Data mine – the action of extracting information and compiling for further analysis.
Fashion – a popular trend, especially in styles of dress and ornament or manners of behavior.
While they sound vastly different from each other, Yale librarians, Peter Leonard and Lindsay King, brought these terms together by creating Robots Reading Vogue. From grant receiving n-gram Search project to student ran projects, Robots Reading Vogue explores the century-old magazine’s history, contents, and trends that account for its longevity.
But does fashion even contain quantified data that can be analyzed? More so, how are robots reading Vogue? These are some of the questions I would like to answer while reverse engineering some of these projects.
First the sources. Leonard and King were only able to create such projects because Vogue was digitized. The Vogue Archive, launched by ProQuest and Condé Nast in 2011, contributes over 2700 covers, 400,000 pages, 6 TB of data. That’s right. Fashion can be quantified, and each page and each pixel are single data point out of the vast data set. Besides the Vogue Archive, Leonard and King used Memos: The Vogue Years, 1962-1971, which contains over 200 memos of Diana Vreeland, who was editor-in-chief of American Vogue. These memos were used to created the Diana Vreeland Memo Generator – a random memo generator based on Vreeland’s writing style.
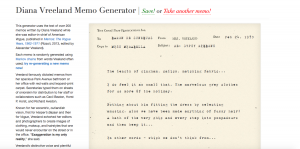
Second processing. These robots were actually reading Vogue (the data set) and analyzing differently for each projects. For example, Markov Chain model was used to generate Vreeland-esque memos. By analyzing the occurrences of words, the generator suggests new strings of words, which copies the sentence structure, length, and punctuation of Vreeland. In Averaging Covers in Vogue, a decade worth of covers are overlaid and a mean RGB value for each pixel is generated. This project explores the general trend of the covers, in which can also contribute to customer behaviorism studies. Further projects used outside tools such as Bookworm which is the open-source version of the Google N-Gram Viewer, learning.py, ffmpeg, Imagemagick, and more.These analysis led to the less intimidating and manageable data that we can view on Robots Reading Vogue today.
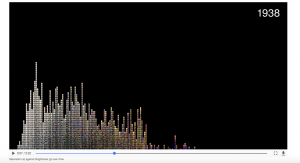
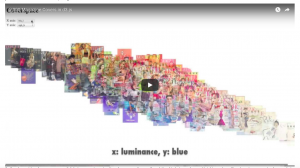
Third and last, presentation. Robot Reading Vogue focuses on organized visual presentation. For Slice Histogram project, the graphs are compiled into a video. The video presentation allows for easy visualization of the evolution of color trends in Vogue. Other visualizations include interactive graphs where users can explore different statistics of the magazine, which also indicates the era of each editor-in-chief. Vogue Covers in Colormetric Space provides a zoomable graph, and a demonstration of an interactive graph that can compare different values of color.
Robots Reading Vogue depicts what digital humanities represent – the cross section of humanities and technology. It provides fun and easy-to-approach analysis that cannot be performed without the help of digital technologies. But the main point of this project? Robots actually like to read Vogue.
Hi Yechan,
I really appreciate how you broke down each of the three sections (sources, processing, and presentation). Prior to that, I like that you defined the terms “data mine” and “fashion” to clearly outline the topic of this DH project. And lastly, I think it is great how you asked questions in your introduction, before beginning the reverse engineering process.
I like the way you organized the whole article, starting with the definitions of the words “data mine” and “fashion” and then separating things in a very logical fashion – “sources –> processing –> presentation”. You have a pretty engaging writing style and I also appreciated the amount of details and links you put in your blog post! (especially the informative video links)