The synthesis of the stereotyped frivolous field of fashion, with the perceptively complex world of data mining is what attracted me to the Robots Reading Vogue site. This project lead by Yale arts librarian, Lindsay King and digital humanities librarian, Peter Leonard explores the multiplicity of layers of data which have made up the Vogue publications produced monthly for over a century.
The project sources its data from the Vogue Archives, established by ProQuest and Condé Nast in 2011. The archives provide data of over 2,700 Vogue covers, 400,000 pages of text, advertisements, images and editorials from the magazine’s pages and 6 TB of data. All of this information provides a great resource and starting point for copious digital humanities projects. The magazines data shows a historical record of popular culture, both its issues and its achievements.
Students, librarians and faculty of Yale University have begun using the data to explore multiple fields and have documented their projects and findings on this site. One of the projects uses the data to create an n-gram viewer comparing and making the text searchable in order to observe correlations and contrasts within the advertisements and articles text. The researchers processed this data by selected five terms ‘corset, girdle, bra, bustier and hosiery’ and searched the archive of texts in order to document when and where the terms were featured. They then produced an interactive graph exploring the frequency of the use of clothing terms ‘corset, girdle, bra, bustier and hosiery’ within the 440,000 texts. The viewer can actively engage with the graph selecting a year from 1892 to 2011 and seeing how often and in what context the word was featured, as the graph is linked directly to the exact articles and pages from the correlating issue of Vogue . From this n-gram we can infer social ideas of the time and consider the progression of the them.
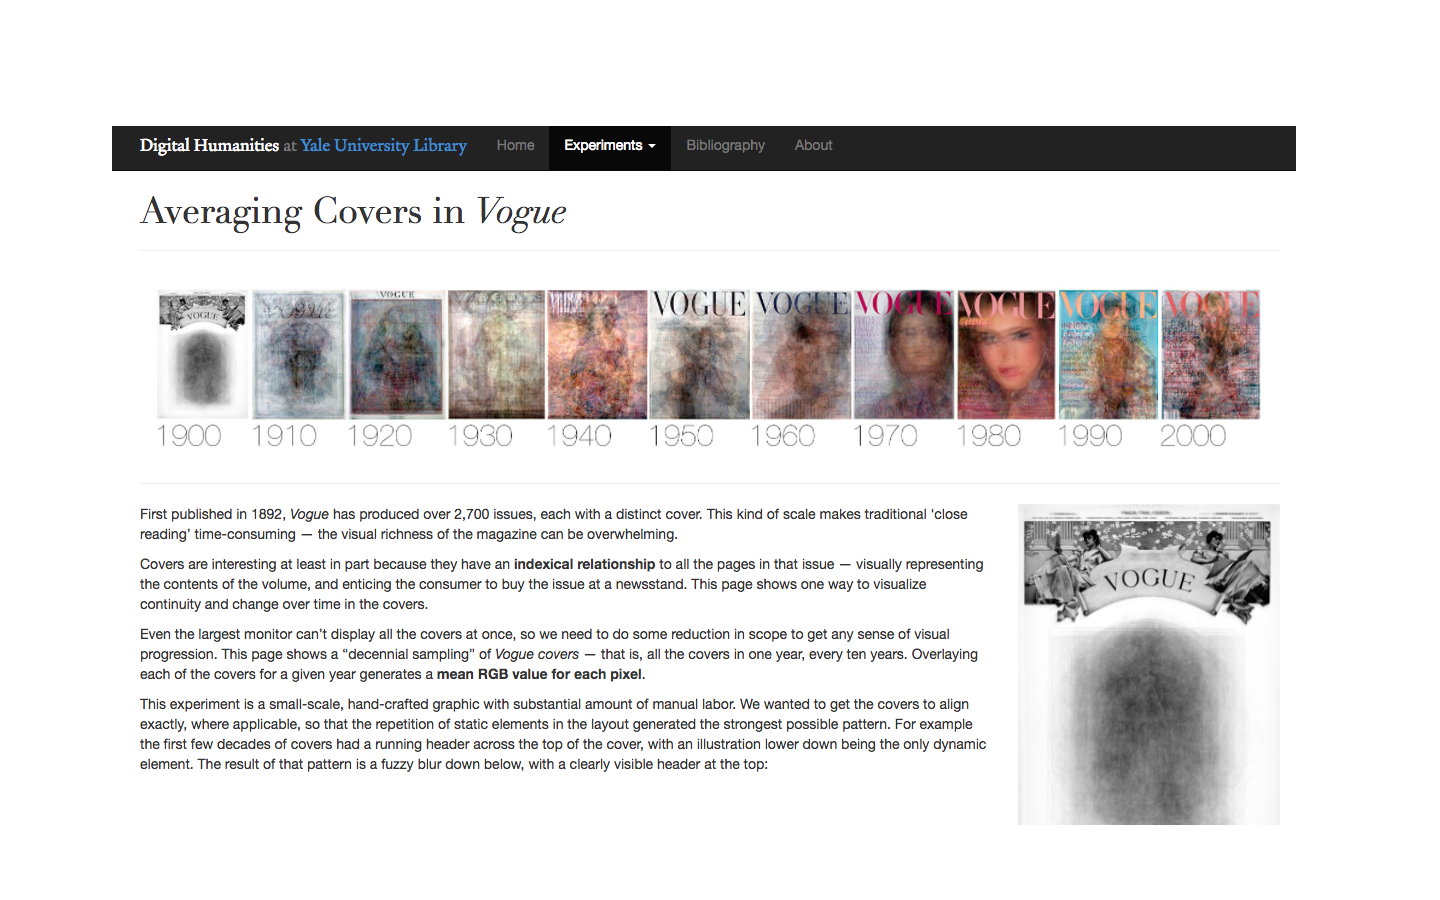
Another project which produced an entirely different product, which produced a more visual and artistic interpretation than the analytics of the n-graph, was the Averaging Covers in Vogue. This project used the visual data of the covers to exhibit continuity and change in the covers over time. The covers represent a visual summary of the whole issue, which text image colour and fonts all contributing to the result. The project reduced the scope of the covers and used a decennial sampling to layer all covers from one year every ten years. The researchers adapted the raw data to alter the variation in gutters and scanning set ups so that the layers would match up more clearly. The overlay of covers produced a mean RGB value for every pixel and the results show the continuation of static elements such as the ‘VOGUE’ header, as well as the blurring and conversation between the changing elements.
There are many other projects within the larger exploration of the Vogue Archives all offering interesting and different interpretations of the data, proving that Vogue offers a rich source of data and contains many elements and ideas beyond its stereotype.
Ailis Swords-McDonnell
Hi Ailis,
I really liked your blog post, in particular I think the attached hyperlinks of the key terms was very useful for readers who are interested in looking at this project in greater depth! Your breakdown of this project was very detailed and thorough, and I got a much clearer picture of the project after reading through your post. Great work 🙂