The story I chose to read was by Margaret Atwood titled “The Martians Claim Canada“. The story itself had only four main dialogue characters; Martian 1, Martian 2, Martian 3, and Amanita Muscaria (talking mushroom). However, the mushroom walks the martians through some of the history of Canada animating such things as wheat, animals, indigenous people, the English, and the French. I decided to include these as separate characters with their own connections in order to make the chart a bit more interesting.
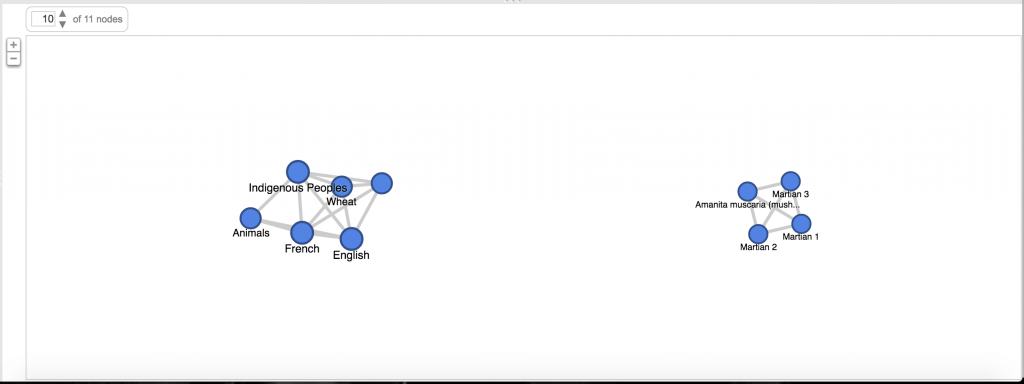
The network analysis shows that animals are much less connected to wheat and mushrooms (in fact no connection whatsoever). This is reflected in the story in that mushrooms and wheat never directly interacted with animals (as described by the amanita). However, through common connections of people, the mushrooms and wheat were affected. It is also interesting to see that the mushroom narrator is connected to the animal/wheat/mushroom/English/French/Indigenous Peoples network, however in the narration does not directly interact with them. The Animata is far more of an omniscient narrator.
The network analysis is useful in realizing how everything within the described story (the animata is describing the history of Canada to Martians), is connected to one another. There are no isolated ends. And although the mushroom and martians appear to be a different network, when you analyze that the narrator itself is a mushroom, it ties the seemingly distinct threads together. The network also further illustrates how history is not individual moving parts but a large interconnected array of influences. I can see how this tool can be useful for biological categorization, historical interaction, mind mapping, etc. It is a useful way to build a network. The limitation of color scheme makes it hard to make distinctions within the network, however it still lays a valuable blueprint to analyze what would otherwise be a less insightful mesh in our own minds.
Here is a shot of the google fusion table analyzing the network of characters in this story mentioned above. You can click the image for a link to the interactive table.