I read “The Martians Claim Canada” by Margaret Atwood. Basically, the story is about three martians from outer space, Martian one, Martian two, and Martian three, who accidentally land in Canada. During their time in Canada they meet a talking mushroom and have some pretty philosophical conversations about what it means to colonize another territory. Atwood probably choose her characters to be martians and mushrooms so she could implicitly critique and question colonialism and imperialism. If her characters were humans, her anti imperialist message would emerge much more clearly, and as a result, she would loose some of her readers. For my edge list, I decided to map what characters talk to each other since the story I choose took place over the course of a single scene. Since all the characters engage in conversation with each other multiple times throughout the story, my network graph resembles a group of interconnected nodes, rather than a few subgroups of nodes like Prof. Posner’s diagram.
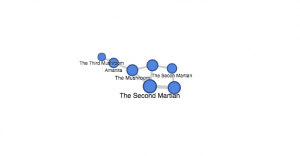
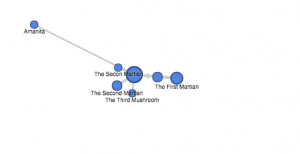
My network graph is helpful for illuminating what characters get to speak the most and how all the characters are interconnected to each other through dialogue. Since the story is so dialogue heavy and not plot heavy at all the diagram is helpful for tracking the relationship between characters by the degree to which they respond and comment on each other’s ideas. I can see the Amanita speaks the least because his node is more isolated from the other nodes. If you look at the diagram above you can see how the Amantia’s node is on the far left. I can also see that the second mushroom speaks the most because he has the most connections between nodes.
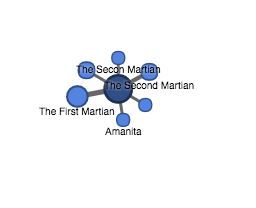
The second martian is represented by the large node in the center and as you can see that when I click on it all the connection lines darken to show how he continuously engages in conversation with all the other characters.
However, the diagram lacks metadata. For instance, the diagram does not reveal if a characters is responding to another character’s idea or proposing his own idea. I could create another network graph that specifically tracks what characters respond to each other if I wanted to know this information. It might also be helpful to create another diagram that tracks what characters agree with each other’s ideas and what character’s disagree. It would also be helpful if there was a way that I could click on each node and it could reveal a line that each character says. The story has so much hidden meaning in it as the characters speak in metaphoric and allegorical terms, but my diagram in its current state does not reveal the meaning behind each character’s words.
For my group’s project I think a network diagram would be helpful to track how subjects are connected to each other by convention. It might also be interesting to create a network diagram that tracks how subjects are connected to each other by how often they appear together in the same picture.
My diagram can be found here
Hi Hannah!
I really like your analysis of how the choice of characters relate to critiquing colonialism and imperialism , that was really insightful! My diagram also lacked specific metadata, so I also couldn’t differentiate between the types of relationships between characters. I think the network diagram might also be helpful for our project too!
Hi Hannah,
I liked the categories you placed on the four characters in this story that gave me more insight that more basic categories would have. I like the part about what your graphs were missing when you said metadata because I completely agree. This graph lacks to portray the data about data– or in other words data about the characters.
Hi Hannah,
Thanks for sharing! Your blog post was very informative and even though I didn’t read this story, I feel like I would have a really good understanding of it if I was to read it. I appreciate how you included multiple images of your network with different organizations, it created a more conclusive story.