For this week, I read the short fiction “Boathouse” by Joe Fosse. This short story was about a woman “Me” who described her feelings of restlessness after seeing her close childhood friend who was now married with two kids now, after not seeing him for over ten years.
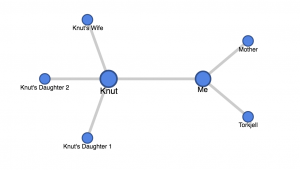
I decided to define a relationship between two characters as an instance of a interaction between the two characters that was described in the story. This graphs allows the viewer to have a clearer depiction of the relationships between the characters in the story. From this, we can also identify the two main characters, Knut and “Me”. However, one limitation is that there may be many more relationships other than the ones explicitly described in the story. For instance, we can likely presume that Knut’s wife and the two daughters are connected, however according this network visualization they do not appear directly connected because there was no description of interaction between them in the story. Furthermore, this visualization does not differentiate between a close tie or a weak tie, so we can only see the number of connections but not the strength of these connections.
This is very well done. I really like how you used the connection with the characters. Your graph also is very easy to read. Well done.
Like the comment above, I think it is very interested that you incorporated yourself into the graph, I would have never thought if this idea. Great Job!
Hi Roshni,
I agree with your criticism to the fusion tables: I also thought it was limiting as it does not show the depth of interaction and relationships between characters. For the story that I chose, Seven People with the Same Name and Their Discreet Moments, that was the case when one of the characters had a monologue. Overall, this was an enjoyable read. Keep up the good work!