The story that my network graphs are based on is titled “The Headless Woman” by Goncalo M. Tavares. Originally written in Portuguese, this tale depicts a mother who has quite literally lost her head. Decapitated by her husband, the mother stumbles through a large labyrinth, looking for her children. Using the trail of blood to find the mother, the three children set out on a journey to find the mother’s head and return it to her. Ultimately the children find the head, but then have to split up to find the mother again. The oldest, who finds the mother, never notifies his siblings of his location by screaming. While this might be because the sheer horror of the situation has left him speechless, or such a lack of assistance was on purpose, the author suggests.
When creating my network graphs, I decided to center my information on the central premise of finding and returning the mother’s head. In particular, I thought that it might be insightful to look at how each of the three children, as well as when they act together as a trio, were helpful in this process. With this in mind, the mother became the central node of my network graph, with 4 connecting nodes attached representing the children (oldest, middle, youngest, and trio). The strength of the relationship between each child and the mother was based on a numerical score of how ‘helpful’ they were in this main story task. I tracked this development of ‘helpfulness’ discretely across the beginning, middle, and end of the story. A point was added or taken away from this score whenever the character committed an act that directly helped/hindered the head retrieval process. For example, the children start off with a high score as a trio in the beginning of the story because they worked together to initially find the mother. However, this score decays rapidly as the children begin to act independently of one another and ultimately split up at the end of the tale.
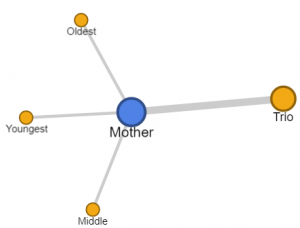
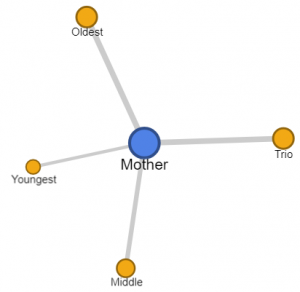
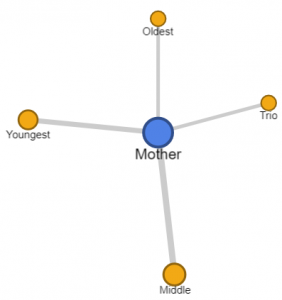
Beginning Helpfulness Middle Helpfulness End Helpfulness
Overall, I thought that the network graphs were helpful in visualizing the elements of character helpfulness, shedding light on how seemingly strong character dynamics in the beginning of a story can begin to decay and change later on. While the children were the most helpful as a trio, it seems that they themselves did not realize this, ultimately bickering and splitting up. Additionally, while one might have a pre-conceived notion that the oldest child would be the most helpful, these graphs indicate that it was actually the middle child who made the fewest mistakes throughout the story. One of the main limitations of the network graph was that it was quite difficult to showcase this progressive change in character development in a single graph. Since the strength of the network connections changed across the start, middle, and end of the tale, I had to create three separate network graphs using different helpfulness weights that depict each stage of the story. Additionally, network graphs run the risk of potentially oversimplifying complex relationships, requiring that people quantify qualitative information about experiences.
Hi! I thought it was a good idea to use the network graphs to show how character dynamics in the story changed over time. I agree that network graphs could oversimplify complex relationships, especially if we don’t have a high level of technical proficiency to create complex graphs yet. Overall, good job!
Hi! I like how you decided to show change over time by creating three separate diagrams. I agree that it is limiting that you can not show this change in one graph. I’m wondering, is the change in helpfulness represented by the shrinking size of the connection lines?
I really like how you displayed the way all of them interact with each other. It made it easy to read and easy to understand what was going on.