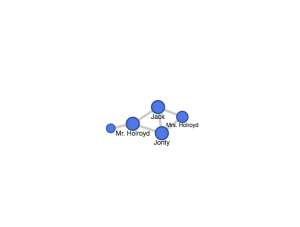
I chose to do my chart from the reading “Sorry to Disturb You,” I find the story very engaging and interested and somewhat related to my life. The story only consists 4 characters: Jack, Jonty, Mr. Holroyd and Mrs. Holroyd.
My chart display the workplace relationship between each character, Jonty and Jack are co-workers, Mr. Holroyd is their boss, and the company is helped by Mrs. Holroyd. The network graph shows that all the characters are connected in some way. However, it is unclear to the viewers what the relationship is about without explanation. In addition, It is also difficult to tell how a specific character is connected to another.
Here is a link to the chart
Hi!
This also happened in my chart– that the graph shows the characters are connected but does not specify in what way they are. I personally suggested that one could probably caption the graph with how they are connected if inserted into a project. I agree that graphing connections in this way has a lack of metadata portrayal–or more data regarding the characters.
Hey there! I was interested to see how you chose to link the characters in this story as I originally picked this one but wasn’t quite sure how to work with it. I appreciate the simplicity of your chart and its easiness to comprehend. Well done!