My graph illustrates the network of Seven People With The Same Name and Their Discrete Moments. The story is composed of seven short stories, each of them describes a self-reflexive moment the protagonist is undergoing, or an experience that triggers them to reflect themselves. The graph illustrates two connections: the inter-connected connection between the seven people with the same name and their connection with influential people in their lives. Being influential means the side characters have contributed to the plot development. Since the author only provides the name of one side character in the story, the graph uses “I1” to “I7” to represent the protagonist “I,” and uses different ways, such as occupation, to represent other side characters.
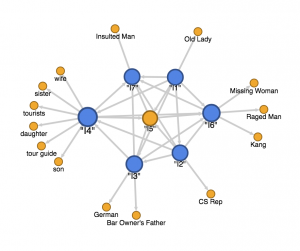
The first connection here shows how the seven “I”s are inter-connected because they have the same name. Even though their stories never overlap with each other, I think they should still be seen as connected because this is the idea of the author. The author intentionally put these seven men, with different backgrounds and experiences, together in one story to let readers compare their lives.
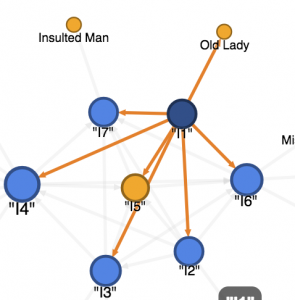
The only person influential to “I1” is an old lady, who he met in the elevator.
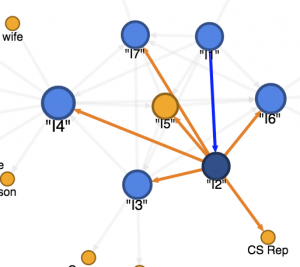
“I2” is an unemployed man with a serious or terminal illness. The only person influential in his story is a customer service representative of the National Health Insurance, who he raged at.
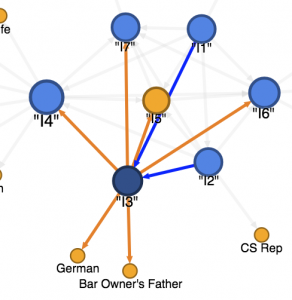
“I3” is a low-income bartender. The father of the owner of the Bar he works and a German customer.
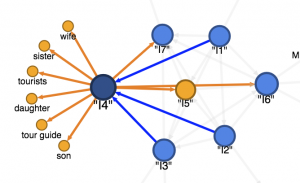
“I4″‘s network is more complex compared to the others. As he was on a tour, the tour guide, other tourists on the tour and his family are influential to him.
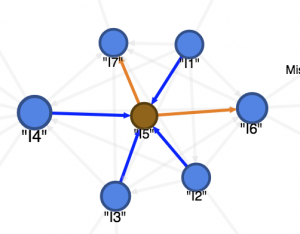
“I5” is a special case because he did not encounter any human being in the story. He is just a creepy stalker who stalks people who share his name online.
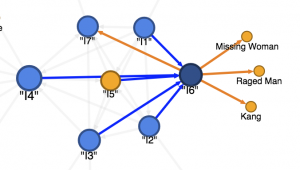
“I6” is a white-collar worker who got a digital coffee coupon accidentally. The people influential to him are his coworker Kang, the sender of the coupon who rages at him on phone, and a missing old lady he sees on a leaflet.
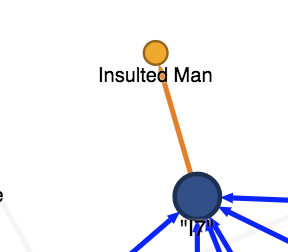
“I7” is a customer in a bar. The only person influential to him is a man he insults unintentionally when he forgets the man’s name.
The main limitation of the network graph is that it doesn’t show the complexity of having a smaller network embedded in a bigger network (the “I” network,) as well as having sub-networks within an original network (every single “I” network.) Instead, I have to simplify the network by combining all networks into one graph and explain it one by one. It could improve if Google Fusion Table allows me to put two networks into different layers. In this case, I would be able to present different networks by adjusting their transparency.
You can tell you put a lot of work into this. Your different fusions that you put together looks great!
Good job!
I can tell you put tremendous amount of work in this! Your network analysis is thoughtful and it’s illuminating to divide it out according to the 7 short stories. I like how you highlight certain part of the graphs to make the relationship clear!
Wow, these fusion tables are great. I love how you dissected the different relationships because the first table can be quite overwhelming to look at. Great Work.