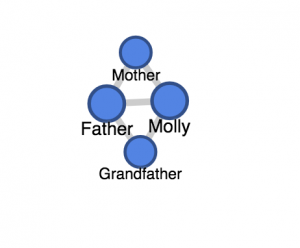
I created a network graph based on “Summer” by Molly Antopol, to illustrate the connections between family members. In the story, the characters are all in one family and the graph depicts their relationships. For example, it shows connections between Molly and her mother and father, as well as her father’s relationship to his father/ Molly’s grandfather. The limitations of this network diagram include limited detail surrounding their relationships, other than who is who’s daughter, mother, father, etc. and the information could probably be more clearly portrayed through another means.
Link to the graph: https://fusiontables.google.com/embedviz?containerId=googft-gviz-canvas&viz=GVIZ&t=GRAPH&gc=false&gd=false&sdb=1&rmax=100000&uiversion=2&q=select+col0%2C+col1+from+1X5x26pnQ3ozDS6EMtMLj5mXdm0aAzDQpbofS-EZW&qrs=+where+col0+%3E%3D+&qre=+and+col0+%3C%3D+&qe=&state=%7B%22ps%22%3A%221_0_-b_y_3_-1b_2_1_-3_-a_2_-1k_1b_%22%2C%22cx%22%3A0%2C%22cy%22%3A0%2C%22sw%22%3A627.8985017354837%2C%22sh%22%3A250.16723601876495%2C%22z%22%3A0%7D&gco_forceIFrame=true&gco_hasLabelsColumn=true&width=500&height=300