I have read “Lagomorph” by Alexander Macleod, a story about a man and his rabbit-Gunther.
There are 5 characters in the story (I have counted Narrator’s three kids as one character because he didn’t mention their name or introduce them individually), and I have connected everyone who has some level of relationship together. For example, Sarah is Alexander’s wife, Sarah and Alexander are three kids’ parents, an Acadian man was the owner of the rabbit (Gunther), Alexander is the owner of the rabbits, Alexander got the rabbit from the Acadian man, etc. By clicking on each node, google fusion table will emphasize the who is connected with the specific person.
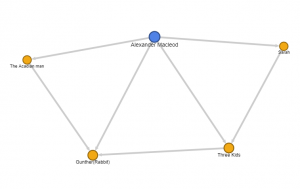
However, it is only showed a limited information. First, when viewers look at the table they will have no idea about who is this character. To solve this problem, the brief introduction needs to be added to each of character. Second, we know these two people are connected, but we don’t know how these two people are related and what story have happened between them. For instance, I couldn’t show the relationship between the rabbit, the Acadian man, and Alexander where Alexander is the current owner of the rabbit and the Acadian man was ex-owner of the rabbit. Third, the level of relationships is not shown that viewer could not know how close relationship two character have through the table. If we can change color for characters when we click on a specific node, it would be better. Lastly, the directions between characters are very confusing (although we can choose not to use it) that it would be better if we could add explanation/story to the arrow between two relationships.