Many of us are familiar with the easy knowledge acquisition opportunity presented to us through infographics. I know that when I encounter a hefty article online I look to see if there are any visual aids to break up the monotony of reading through all that information or better yet, if there is an image that digests and summarizes the main point of the article.
Reading through the Data + Design online book, I began realizing just how much work goes into constructing an appealing infographic. In addition to actually making the graphic there is so much thought that goes into how to effectively collect data to display. The book dedicates pages, and even chapters, to describing some of the best modes of data collection for research; researchers have to be careful in the language they choose for questions and the format in which they present the questions and possible answers. Once the information has been collected, there is a long process of data cleaning and prepping (who knew data needed so much attention before going out into the big world!). This cleaning involves sorting through things that are relevant to the research question/goal and figuring out a way to organize it nicely so that it can become the best visualization it can be.
Browsing through this lengthy process gave me so much more respect for the work that anonymous internet people do in making up these easy to use and disseminate informative images. One of my favorite sites that has some really great infographics/visualized data is Brain Pickings. (The creator, Maria Popova, actually got a mention in the Data + Design foreword!) What I love about this site is that Popova does so much research on some very interesting topics, usually on literary or art related topics. In many of her articles she includes images from the books she is discussing, or hand-drawn visualizations of quotes from famous literary folk.

Reading a quote from someone is one thing, but having a way to interact with the author’s ideas in a new way gives it a level of engagement that continues to fascinate and bring me back to their words.

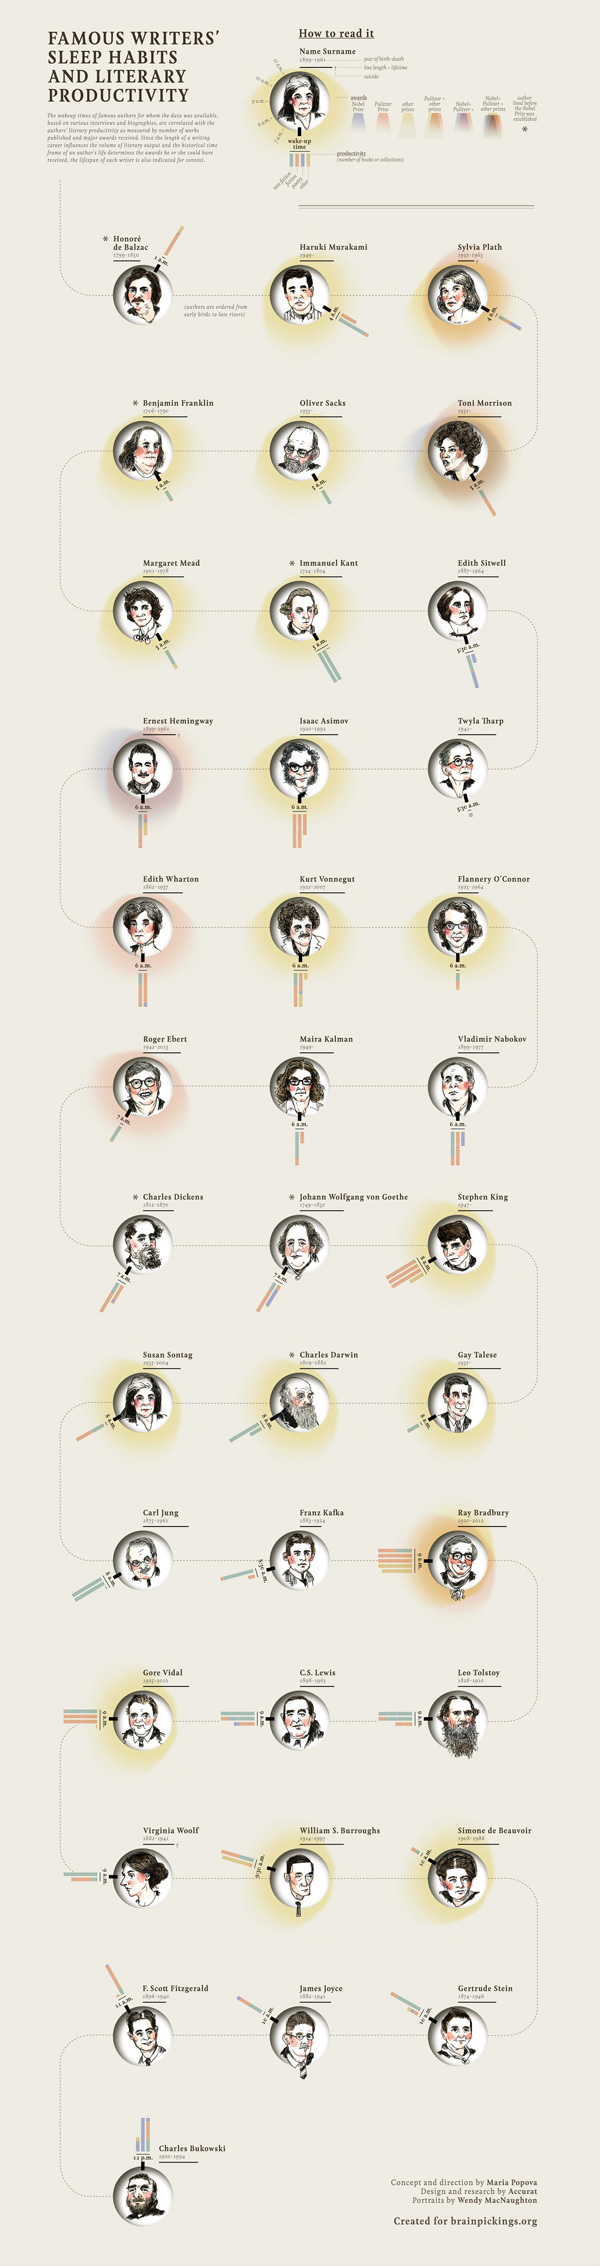
I recently came across an article on the Brain Pickings site about Infographics and some key principles to keep the visualization interesting and trustworthy. This article features designs that compile information on jazz musicians from the 1920s, junk emails, and the London Tube. This goes to show that data visualization does not always have to come in graph form or present information on groundbreaking sociopolitical topics. As with any presentation of data though, there is the possibility that data is incorrect or skewed in some way, so there is always that thought to keep in mind. With that said, however, here are two of my favorite images from this article that organize two very different types of information – statistics about the world’s makeup and sleep habits of famous writers.

