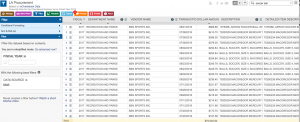
This week I looked at the dataset on what the LA city buys for its residents and departments using taxpayers money. The data can be examined through the procurement dataset in detail and scope, while the first link shows featured data through “data cards“. In the procurement dataset, the records consist of each item bought by the city, and is organized by fiscal year, department name, cost, transaction date, the supplier, etc. On the other hand, the data cards show images of certain items the city has bought more pertinent or of interest to the residents of the city, such as 6,670 soccer balls at the cost of $8,549.
Wallack and Srinivasan describe an ontology as “systems of categories and their interrelations by which groups order and manage” (pg. 1), and such a system discerns information about people, places, things, and events. This particular dataset’s ontology creates a relationship of transparency with the public as to how government funds and taxpayer’s money is utilized and given back to the community. The data cards do a good job of catering to the average users to specify why certain procurements are necessary. Not only that, by visualizing the items bought for the citizens, the City can show the immediate benefits and the appeal of certain items through images. Each data card is unique in image, description, and even font to appear more user-friendly.
One can click the image to get more information, such as what the item is, why such an item was bought, a “did you know?” section, and a link that leads to the procurement dataset to access the rest of the specific information.

Government officials, especially those who are making the new fiscal budget proposals, would find the procurement dataset most useful. Residents who also seek to research extensively and advocate for certain budget proposals and allocation to a program of their interest may also find the procurement dataset useful. However the average citizen would find the data cards more entertaining, interesting, and visually appealing. For example, one might wonder why the city spends thousands of dollars 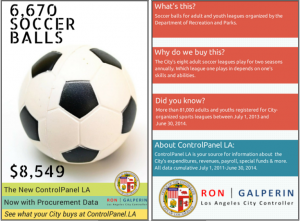 on soccer balls, but buy clicking the information one will immediately notice that about 81,000 adults and youth participate in the City’s organized sports leagues.
Usually the problem with ontologies, particularly mismatched ontologies, is that there is a tendency to lose information. However I believe the LA City Controller chose well to add the data cards because it fills in the information that is lost in the procurement dataset. Otherwise one might not have known that large frozen rats are bought to feed the LA Zoo animals, and there may have been confusion or unhappy residents with a purchase of frozen rats without knowing why. Of course there is no way to do a data card for every single item bought, and that is where some information is lost. Otherwise, maybe there could be an option in the procurement dataset to click on more information about each item that briefly explains the purchase, not necessarily create it’s own data card.
Great post! This dataset is really interesting and you did a really good job explaining it. The data cards seem like an easy way for the average person to feel like they know more about where the city’s money is going and perhaps allow them to voice their concerns about what the city is spending money on.