The dataset I select today is the City Payroll Data, which includes quarterly payroll information for all Los Angeles City Departments since 2013, updated by the Los Angeles City Controller’s Office. As displayed in the spreadsheet, the data are assorted according to various types: 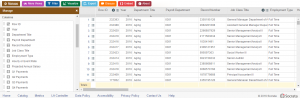 Row ID, Year, Department, Title, Payroll Department, Record Number, Job Class Title, Employment Type, Hourly or Event Rate, Projected Annual Salary, Q1 Payments, Q2 Payments, Q3 Payments, Q4 Payments, Payments Over Base Pay, % Over Base Pay, Total Payments, Base Pay, Permanent Bonus Pay, Longevity Bonus Pay, Temporary Bonus Pay, Lump Sum Pay, Overtime Pay, Other Pay & Adjustments, Other Pay (Payroll Explorer), MOU, MOU Title, FMS Department, Job Class, Pay Grade, Average Health Cost, Average Dental Cost, Average Basic Life, Average Benefit Cost, Benefits Plan and Job Class Link. While there are 285008 rows stored, a record in this specific dataset refers to the aforementioned profile of a department in the city.
Wallack and Srinivasan, in their writing, suggested that the ideological effects of the way in which sources have been divided into data could be recognized as either meta-ontology or community ontology. Since the dataset is clearly collected and uploaded by Los Angeles City Controller’s Office, there is no doubt that it is an information system operated by the state. Reflected through the design of certain data types is the official perspective that creates this dataset: Average Health Cost, Average Dental Cost, Average Basic Life and Average Benefit Cost are all calculated as expenditure from the government, instead of the real costs of the citizens. Thus, the current dataset caters to purposes of budgeting and shows less concerns from the community. It makes the most sense for officials who are monitoring the annual expenditure as well as analysts interested in policymaking and institutional design.
On the one hand, this dataset demonstrates a detailed, official payroll information of all Los Angeles City Departments; on the other hand, however, it fails to evaluate the effect of the payments on workers. To compensate for its shortcoming, I would try to shed some lights on the well-being of the community : for example, tackling income inequality will be much easier if the dataset contains the distribution of salaries among different gender, race and ethnicity in the same department. Similarly, comparing people’s average spending on health related issues to the corresponding payment from the government will make more sense than a unilateral payroll information. By and large, more community concerns can be covered with this approach, and the dataset can present more than one perspective although mostly applying meta-ontology.
Hello, I really enjoying reading your blog posts! Thanks for providing an image of the dataset to gives readers who didn’t do the assignment as idea of what it looked like. I really enjoyed reading your critique and would love to learn more about the effects on the workers!
Great blog post! I enjoyed reading your take on this dataset and looking at it myself. I agree that the data can do more to look at the affects these payments have on the community. By creating more data types to reflect a person’s gender, ethnicity and such will help tackling income inequality.