From the LA Controller’s Office, I chose to examine the dataset denoted “Gender Breakdown of City Workers by Department.“
The source of the data was the city payroll department, which provided information on the distribution of wages as an aggregate, as well as divided between the two genders. The city’s process of organizing this data consists of transcribing the data onto a spreadsheet, uploading it onto the city controller’s website. The dataset was presented using a simple spreadsheet the user can navigate, but there also included the option to view the data through a series of data visualizations (bar/pie graphs, etc.)
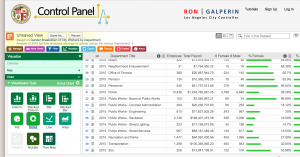
*view of the user, notice the many options for visualizations
The record in the dataset consists of the following: the year, department titles, employee count (# of male, # of female, % of male, % of female), female total salary, male total salary, female average salary, male average salary, % of total payroll to women, and % of total payroll to men.
In Wallack and Srinivasan’s paper, they describe datasets ontologies’ as “systems of categories, and their interrelations by which groups order and manage information about the people, places, things, and events around them” (1). Thus, the city’s ontology for The Gender Breakdown of City Workers by Departments is an attempt to communicate the distribution of wages between male and female city workers in specific governmental departments using a variety of percentages and aggregate wage amounts.
This data is not hard to read, thus it can make sense from many points of view. However, if they city’s goal is to provide an unbiased view of gendered employment within the government, this data raises more questions than answers. I think many feminists groups would find this data illuminating and outraging, for it is clear that women are making far less than men in nearly every department. In addition, government officials can refer to data like this during hiring practices, as well as anti-discrimination lawsuits.
This is where the problem of mismatched ontology comes in. Wallack and Srinivasan write that “States’ attempts to promote ‘development’ are thus limited by the information loss between the community ontologies that define development and meta ontologies that guide their actions” (3). The information “lost” here would be more specific job titles, how long individual’s had been employed, and relative satisfaction one has with their job. I realize this is out of the scope of what the city entailed for this data, but it would go a long way to promoting communication between the community (who may be upset by datasets like these), and the government which is working towards diminishing gender-based discrimination. I believe the city has good intentions in making this data public (many governments would never do this out of fear of lawsuits and citizen complaints), but by leaving out specific job titles, and limiting the data to a single year, they are raising more concerns than answers.
If I was to completely start over with data collection, I would work to provide more data, encompassing multiple years and specific job titles. This would provide a more accurate picture of gendered employment in the government, and whether the disparity between male and female wages is diminishing, bridging the gap between the community’s ontology and the meta-ontology promoted by the government.
I agree that data encompassing multiple years would help viewers to make sense of the data, or rather to determine whether it represents a positive or negative change. This would also help the viewer to construct a narrative, likely with a feminist ontology, such as women’s progress (or lack thereof) in securing equal pay for equal work. While I also agree that it is admirable of the city to even release such controversial data, it can seem discouraging and not all that helpful to demonstrate the problem without providing any solutions. An interesting question to ask is whether those who assemble and present data have any obligation to make sense of and/or pose solutions to the problems that data raises.
Yeah it’s definitely a tricky situation. I don’t think it’s the job of the LA Controller’s office to propose solutions to these inequalities, however other branches of the government should use this data to implement reforms in hiring and promotion practices. I applaud the city controller for even releasing this data, it’s more than many other departments around the country would even attempt.