The work of short fiction I selected is the story Given by Jesmyn Ward. It is about the killing of a Black football player named Given. For me, what constituted a connection between the characters would be them interacting with each other within the story. The characters in the story are as follows:
- Given
- Pop (Given’s father)
- Given’s White teammates
- Given’s Black teammates
- I (the narrator)
- Mama
- Police
- Big Joseph
- Michael’s cousin
- Michael’s uncle
- Michael’s mama (mother)
- District Attorney (DA)

The network graph, as shown above, allows me to see which characters have the most connections. Expectedly, Given, as a key character in the story, has a larger number of connections (5) relative to the other characters.
Surprisingly, however, it is Michael’s cousin (whom we might not consider the protagonist) who has the most connections with 7. This may be because of his murder of Given – two of the people he is connected to (his father and the District Attorney) were involved in discussing and determining the possible consequences of his crime.
In contrast, the narrator only has 3 connections – Mama, Michael’s cousin and Given. Perhaps it is this distance from most characters in the story that allows him to observe more and be an effective narrator.
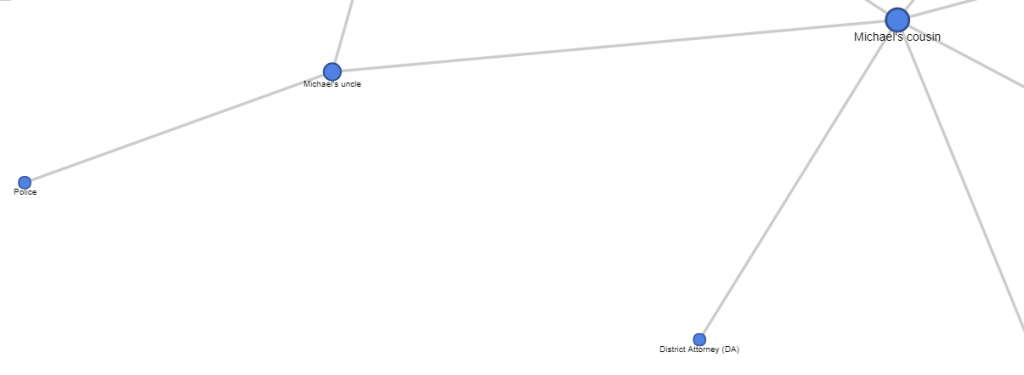
As seen above, the network graph also shows that some characters, specifically those with only 1 connection, appear very tangential to the story. Examples of such characters would be the Police and the District Attorney, who play short-lived, transactional roles as justice administrators. Another example would be Michael, who in fact does not appear in the graph at all despite his name often being used to denote other character’s identities. The narrator merely uses Michael’s name to establish a degree of familiarity with the murderer (Michael’s cousin) and his family members.
However, this graph is limited as it does not show the basis for characters’ connections. For example, we would not be able to deduce from this graph that Michael’s cousin and Given are connected because the former killed the latter. We would also be unable to realize that Michael’s uncle slapped his son for the crime he committed.
The graph also does not show the relative strengths of connections between characters. In the Weingart reading, it is mentioned that subsequent interactions may increase the weight of an edge connecting two nodes. However, edge weights are not shown here. We would not be able to know, for instance, that Given has more interactions with Pop than he does with the narrator.
Overall, I feel that network graphs are a useful method for depicting connections between characters. However, to show more detail and meaning behind the connections, we would definitely have to learn more about using network graphs.
Hi Rebecca!
I enjoyed looking at your graph because I also made my diagram based on the character’s interactions. However, since my story only had four characters, my digram is not as large as yours. I also noted that my diagram lacked metadata or did not give any important information about the character’s connections.
Terrific post, Rebecca!
Hey hey. I too did Given for my network graph and found it very interesting to see the discrepancies in the way that we graphed the same story. I appreciate your critique of the inability to gage the strength of each connection – as it wasn’t something I thought of myself.