This week I decided to analyze the digital humanities mapping project called Locating London’s Past. This project seemed extremely interesting because it lets visitors compare a GIS compliant map of London in 1746 to a map of the area in 1869-1880 and modern day. Furthermore, it allows users to annotate the map with geocoded data points from a wide variety of digital resources. It serves as a crowd-sourced geographic dataset that people can use to visualize textual and artifactual data relating to 17th and 18th century London.
According to Turnbull, “maps [should] be capable of transmitting information, [and] have to be intersubjective”, since they have to be read and understood by a diverse audience. I believe that the cartographer reflected the majority’s point of view on this map in order to appeal to his audience. The authors also ensure that this map could be useful to the masses by assuming that the user knows exactly what he/she is looking for in terms of data and area.
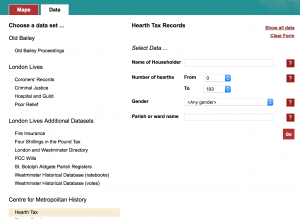
This project holds a healthy mine of interactive information; it reveals what London appears like to inhabitants and tourists alike. It uses general terms and names for areas. It allows users to search information ranging from death rates to population densities for specific parishes. However, this map is far from perfect; it obscures famous historical landmarks by not highlighting them. It also does not include colloquial names for the different areas in London. Often times locals refer to areas by new names that might be more descriptive of the area than their proper name.
While I am truly fascinated with the scope of this project, I believe that the author could have done a better job displaying the maps. In my opinion, it is difficult to navigate the different datasets that are preloaded on the website. I understand that the authors were looking to make this project easily used for specific searches, but it is somewhat daunting for a passerby looking to learn some general knowledge. I propose that they should create a more intuitive map that does not rely on a scanned copy of Rocque’s original copy. If the authors used his map to create a completely new model, they would have greater autonomy over what capabilities they offer to their audience. For example, they could color-code regions based off high/low death rates.
Nice post! I agree with what you said about improving the UI/UX of the maps because of their awkwardness and clunkiness, I felt the same way about Digital Harlem.