This week we were got a chance to look into and use OpenRefine to understand more on data organization. OpenRefine makes data easy to manipulate and accessible for our use. My group will be looking into the artwork at the Williams College Museum of Arts.
A few ways our group would want to organize is by categorizing it with dates/ time periods, artwork origin, artwork medium, and main colors. Our research questions look mainly into comparing the different artworks against each other. OpenRefine will be super useful in our project because there are hundred of different art pieces that are showcased and represented within the Williams College Museum of Arts. Upon opening up the csv file of our data into OpenRefine, the data displayed quite differently than the tutorial example that was provided.
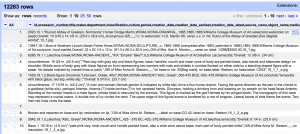
Our data would need to be separated into separate categories because as of now the data mushed into one. Afterwards, we would probably have to clean up the data for it to be more organized and accessible. I think one thing that might be useful for our data is to add photographs of the artworks at well. Overall I believe that OpenRefine will be such a great tool when working on our project and it’ll become super helpful with organizing and viewing data.