Short Story Network Analysis

This week I decided to examine a short story called First Semester by Rachel B. Glaser and John Maradik, found within Granta 136: Legacies of Love online. The method of analysis I chose to use was a network visualization.

This short story predominantly focuses on the perspective of the main character Sarah who has just recently started her freshmen semester of college and describes her initial experiences as she grows throughout the semester. It follows her pursuits through her various relationships with other students often angled in terms of her sexual development throughout the semester and how that also affects her mental state as well.

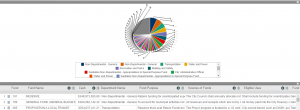
In order to examine this story I broke out my network visualization by looking at any direct interaction of a relevant character vital to the current scene as a guideline for my edge list. Examining the visualization, it points out how Sarah is the predominant main character in terms of interactions with others throughout the various scenes of the story. It also points out how there is somewhat of a social group/circle among Sarah, David, Colin, and The Pip (The opposite worlds girl).

The visualization does lack however in identifying how weak or strong a connection between characters might be. It doesn’t include a weighting system to distinguish relationships that are weak, for example Sarah’s brief conversation with the petworld employee, versus a stronger bond like Sarah’s relationship between herself and David. If I were to fix this issue for a further iteration of the network graph I would try to establish a weighting system that used the number of scenes that two characters interacted within to distinguish between the various spectrum of relationship strength.

Mapping Project Analysis: Digital Harlem

This week I decided to analyze the Digital Harlem mapping project. This project aims to depict everyday life in New York City’s Harlem area within the years of 1915-1930. It  has been drawn from legal records, newspapers and other archival and published sources gathered between those times. It aims to focus not on black artists and the black middle class, but on the lives of ordinary African New Yorkers.

The map allows options to view the borders of black settlements during 1920, 1925, and 1930. You are able to filter the view of the map by search categories which encompass events, places, and specific people. Within each of these categories you can narrow down your search by limiting the criteria to options like keyword, dates, charge/conviction, race, gender, occupation, name, and street address.

As the Digital Harlem site is examined, it is important to keep in mind what assumptions the underlying data is built on. If one were to initially look at crime data during this time period, the map would almost be completely filled up with data focused on African Americans. However, this kind of scenario might not at all be an accurate representation of what the daily life actually was like for residents of Harlem during this time. Legal records, newspapers, and published sources might all be inherently biased to a perspective that is promoted by police officers, the government, and even the local media of that time. The site loses out on information and data that could have come from the perspective of a local citizen of Harlem at the time for the categories that Digital Harlem site is based off of. Legal records and newspapers show you information based on altercations/infractions with the dominant class of those times while ignoring simple events which wouldn’t be noteworthy to have been recorded during those times.

If I were to create an alternate map I would first try to see if I could gather data from a more “ground”-focused approach. I would try to get information from people who had relatives who had lived in the area during that time period to get stories and data for how everyday life typically was for them.

Data Visualization Analysis

For this weeks analysis, I decided to focus my efforts on analyzing the data set related to New York’s Museum of Modern Art (MoMA). This dataset included various aspects regarding MoMA’s artwork collection such as Title, Artist, Gender, Department, and Acquisition Year. These are only a handful of the many kinds of categories provided in the dataset.

In order to do some exploratory research I tried to utilize Tableau to generate some data visualizations to help guide further research progression on this dataset.

One visualization I examined was a comparison of Artist involvement within each department at MoMA as shown in Figure 1. In this visualization the departments are organized from largest in terms of artwork records on the outside decreasing as it goes inward for the overall circle. The individual circles represent the individual artists with size corresponding to how many artworks they’ve submitted for that department. The two biggest departments are shown to be Print & Illustrated Books and Photography with the largest contributors for each to be Louise Bourgeois and Eugene Atget respectively.  The visualization helps showcase what are MoMA’s biggest departments in terms of artwork pieces as well as to show how condensed they might be to a few major artists.

Figure 1: Artist and Department Bubble Graphsheet-2


A second visualization that I analyzed was an analysis focused on charting out MoMA’s artwork acquisition dates on a time-plot as shown in Figure 2. The visualization overlays these acquisitions in terms of departments so it can then be shown which departments were most active in which periods. Looking at the chart, 1960-70 and 2008 stand out as major acquisition periods. The visualization helps showcase how wide a disparity these periods have in comparison to other years, something which would be much more difficult to quickly interpret from just looking at the raw data.

sheet-3

Dataset Analysis: Los Angeles Balance of All City Funds

The dataset analyzed today is from the L.A. Controllers Office and is specifically focused on the Balance of All City Funds dataset.

Datatypes

For this dataset, the data is organized into 42 categories of which include the following:

  • Fund
  • Fund Name
  • Cash
  • Department Name
  • Fund Purpose
  • Sources of Funds
  • Eligible Uses
  • Fund Category
  • Ending Fund Balance
  • Revenue
  • Disbursement

A record in this dataset is constituted as an individual funds profile entry based on the 42 categories above.


Interpretation

From Wallack and Srinivasan’s paper, Local-Global: Reconciling Mismatched Ontologies in Development Information Systemsa definition for ontology is given as “systems of categories and their interrelations by which groups order and manage information about the people, places, things, and events around them.” This definition for an ontology can then be interpreted as meaning that a dataset ontology is the underlying significance of how the datasets organization is used by its users to organize and facilitate the interpretations that the original creator intended for it. For the Balance of All City Funds dataset, its ontology points to an organization focused on delineating how each of the cities departments focus their budgetary spending.

This kind of ontology makes most sense for someone either working in the LA budget office overseeing how government funds are allocated or even simply a concerned citizen who might be interested in seeing how effective their tax dollars are being spent. Being able to sort by aspects like specific funds or even departments lets these individuals narrow down their search related to whatever they are specifically looking for in those categories.

Looking specifically at department spending, we see that Transportation, Water and Power, and Recreation and Parks are the three highest non-general category departments in terms of cash.  capture


In terms of things that I found lacking, I do find myself wanting for more detail for some of the spending that the funds themselves are doing in terms of specific contractors and projects. The dataset is organized on a much more macro-scale which allows a viewer to see what kinds of departments might be successful and in trouble, but it doesn’t let you see the “why” for how those departments got into those positions.

If I were to remake this dataset into a different ontology, I would have it organized in a fashion that breaks down the assets and liabilities a bit more in-depth so if an auditor for that department used the dataset, they could more easily identify the pros and cons of that departments budgetary spending.


George Meyer Simpsons Script-Finding Aid

For this week I chose to explore a Finding Aid related the George Meyer’s script files in reference to Seasons 2-6 (1990-2004) of long-running television comedy, The Simpsons. The physical collection of scripts is . stored off-site at the Southern Regional Library Facility (SRLF) at UCLA. The physical collection contains script files, story notes, outlines, and/or various script drafts written or co-authored by Meyer. In addition the collection also contains a photocopied version of The Simpsons character design guidelines.


George Meyer’s Background

George Meyer’s writing background starts during his sophomore year at Harvard where he joined the writing staff of The Lampoon and established many important long-term relationships. In 1981 he transitioned to writing for the David Letterman Show and eventually ended up writing for Saturday Night Live as well. Meyer ended up writing for The Simpsons in late 1981, a few months before the show premiered, and eventually went on to become an executive producer for the show. This short biography which was presented in the finding aid helps paint a picture of how Meyer’s early writing experiences might have helped contribute to his writing style for The Simpsons.


Finding Aid Organization

The finding aid is organized alphabetically, an inconvenience since a chronological order would better allow someone to analyze how the writing style might’ve changed/incorporated current events of those times.

It starts out by listing a Censor Notes file based on 1989-1996. This is relevant to showing what factors Meyer’s was unable to incorporate/work around during those times, but because it is only limited to a time-frame of 7 years it isn’t helpful for any scripts past 1996. To form a good narrative analysis one would have to examine two categories of Meyer’s scripts, those within the Censor Notes time period and those after it in order to understand if there was writing style change.

Next the finding guide lists a character design guide and episode guide for seasons 1-9 within box 77. An analyst can use this to draw conclusions regarding how character designs might’ve shifted throughout various season changes as well as to the thought processes and insights used in creating various characters, settings, and season narratives.

The rest of the collection, which features the main bulk of files, contains script files featuring various drafts and outlines for the Season 2-6 episodes. The finding guide only mentions a brief annotation and writer note for each of these.


Improvement Recommendations

If I were to personally recommend some improvements to the finding guide I would recommend first and foremost to organize it chronologically. My reasoning for this is because this kind of format makes it easier to see what kind of writing style shifts might’ve occurred based on any current events for those time periods. Another suggestion I would make would be to feature maybe a brief episode synopsis note in the annotation section. This additional context can help shape a contextual frame for what each episode pertained to. In addition this ties back to the chronological order where a viewer can then piece together possible season arching narratives.


Taking a Look at Photogrammar

Origins


Photogrammar is a site created by Yale which seeks to be a digital platform that organizes the 170,000 photographs from 1935-1946 created by the United States Farm Security Administration and Office of War Information (FSA-OWI). These photos were originally taken as method to building trust and support for government programs for the Roosevelt Administration during the Great Depression Era. They were undertaken by the Historical Section of the Farm Security Administration as way of documenting the United States at one of its worst periods of time, as well as a way of documenting the successful administration of aid relief.  

In terms of raw navigation the site starts out with a helpful welcome page that lists options for how to begin exploring the collection, finding out about its background, and for finding new experimental tools as well.


Sources:

The collection used to build Photogrammar includes 170,000 overall photographs. 88,000 of these are printed and placed in the office of the FSA-OWI. 77,000 of the photographs were printed by Roy Styker’s Historic Division of the Farm Security Administration. The other 11,000 come from other sources.

In terms of overall collection origins, the database has grown to include six different collections. The majority of the photographs from the Farm Security Administration collection and Office of War Information collection.   The other collections include the Office of Emergency Management-Office of War Information Collection, the American at War Collection, the Portrait of America Collection. All these collections are overall organized and cataloged by the Library of Congress.

Processes:

In terms of data processing, the Photogrammar tool had a lot of help with the fact that the Library of Congress had already digitized the photograph collection for them. The team instead had to to organize the overall data into a database that could then sort out geographic and classification information into an easily searchable format.

Presentations:

The Photogrammar team uses a variety of tools to organize and display the large amount of data that they are using.

In terms of the main visualization used, the Photogrammar site uses two different versions of its mapping visualization to show the photograph locations in county and dot format.

County:

screen-shot-2016-10-03-at-1-07-56-pm

Dot:

screen-shot-2016-10-03-at-1-08-06-pm

One of the tools they use is CartoDB which is used as a database that serves as the primary mapping mechanism for the site due to its scalability and balance of raster and vector data formats.

A second tool that they use is called Leaflet. This is used for its capabilities as an Open-Source JavaScript Library for Mobile-Friendly Interactive Maps. The library provides an excellent general library for creating dynamic graphs.

Another tool they use is a Treemap to serve as visualization of the original classification system designed by Paul Vanderbilt in 1942. 88,000 of the photographs were assigned using this classification system which uses 12 main subject headings and 13000 sub-headings which lead into various sub-sub headings.

A fourth major process/tool used on the Photogrammar site is the Metadata Dashboard. The dashboard is used as an interactive tool to display the relationship between date, county, photographer, and subject in photographs from individual states using the already categorized metadata of the photographs.