The dataset analyzed today is from the L.A. Controllers Office and is specifically focused on the Balance of All City Funds dataset.
Datatypes
For this dataset, the data is organized into 42 categories of which include the following:
- Fund
- Fund Name
- Cash
- Department Name
- Fund Purpose
- Sources of Funds
- Eligible Uses
- Fund Category
- Ending Fund Balance
- Revenue
- Disbursement
A record in this dataset is constituted as an individual funds profile entry based on the 42 categories above.
Interpretation
From Wallack and Srinivasan’s paper, Local-Global: Reconciling Mismatched Ontologies in Development Information Systems, a definition for ontology is given as “systems of categories and their interrelations by which groups order and manage information about the people, places, things, and events around them.” This definition for an ontology can then be interpreted as meaning that a dataset ontology is the underlying significance of how the datasets organization is used by its users to organize and facilitate the interpretations that the original creator intended for it. For the Balance of All City Funds dataset, its ontology points to an organization focused on delineating how each of the cities departments focus their budgetary spending.
This kind of ontology makes most sense for someone either working in the LA budget office overseeing how government funds are allocated or even simply a concerned citizen who might be interested in seeing how effective their tax dollars are being spent. Being able to sort by aspects like specific funds or even departments lets these individuals narrow down their search related to whatever they are specifically looking for in those categories.
Looking specifically at department spending, we see that Transportation, Water and Power, and Recreation and Parks are the three highest non-general category departments in terms of cash. 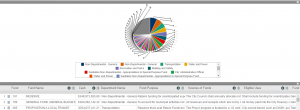
In terms of things that I found lacking, I do find myself wanting for more detail for some of the spending that the funds themselves are doing in terms of specific contractors and projects. The dataset is organized on a much more macro-scale which allows a viewer to see what kinds of departments might be successful and in trouble, but it doesn’t let you see the “why” for how those departments got into those positions.
If I were to remake this dataset into a different ontology, I would have it organized in a fashion that breaks down the assets and liabilities a bit more in-depth so if an auditor for that department used the dataset, they could more easily identify the pros and cons of that departments budgetary spending.
Great post! I enjoyed how you broke it up into sections and even included a picture of the data visualization. I agree that this dataset seems to be from a “macro” viewpoint, which is a trend I believe most of the other datasets have as well. I wonder if this is because this dataset has a more of a “state ontology”(like from the Srinivasan reading) because it was compiled by the LA Controllers Office instead of a “community ontology” where the dataset would be compiled from people within each specific department. This would potentially provide a more “micro” viewpoint and reveal more specific issues in regards to funding.
Nice explanation of the data types and data record. Good use of the added web design components in wordpress. Excellent job breaking out your answers for every question in the prompt – very clear and thoughtful!
I really enjoyed reading your post because it was so structured and clear. I also thought that the inclusion of the image was very helpful for illustrating your point. You are right that more information would be useful, as as it stands the dataset is not comprehensive for somebody who would like to know more about these projects. While it provides a good overview, someone who is looking at it would likely want to go into detail into at least some of the projects.
I really enjoyed reading this post! I agree with your point that including assets and liabilities would make it easier to asses how the departments are spending their funds. I also agree that it would be interesting to somehow learn more about why departments are doing well or poorly. Although the dataset provides a lot of information, there are also a lot of questions left unanswered, especially for an average citizen who looking to learn more about the city funds.
Risha Sanikommu