A team of seven professionals and scholars hailing from Yale University contributed to compiling hundreds of thousands of photographs dating back to World War II and the Great Depression into a project titled Photogrammar. Having originated from such a serious period of time, these iconic photographs vividly depict the poor living conditions, effects of the war, and hardships that Americans endured during the 1930’s and 1940’s.
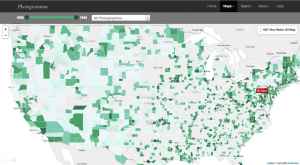
Photogrammar, as seen above, organizes, details, and visualizes information collected from the United States Farm Security Administration and Office of War Information in the form of an interactive, well-organized (thanks to the cataloguing system created by Peter Vanderbilt) map made web-accessible (and therefore publicly-accessible). From this map, we see regions in the United States with varying shades of green; a dark forest green color indicates that a high volume of photos was taken in that county in that state while areas with a mint green color are counties in which a small amount of photos were captured. Furthermore, based on what areas of the United States have the darkest shades or lightest tints of green, we can extrapolate what parts of the country experienced the most or the least events and, by using the cataloguing system (essentially filters such as “Lot Number” and “Photographer”) created by Peter Vanderbilt, we can determine whether these photographs captured moments that were related to war, the social lives of Americans, or the development of land.
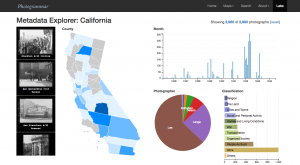
This project also provides this interactive dashboard showing what photographs were taken during which year, in what county of California, and by what photographer as well as what classification tag they fall under. Even though this feature is only available for photographs taken in California, I like the way data is visualized here better than in the United States map above. On this page, you can clearly see who the prominent photographer was (Russell Lee, according to the pie chart), what the most common subject of the photos was (work, according to the horizontal bar graph), what year the most photos were taken (early 1942, according to the vertical bar graph), and what region of California had the highest volume of photos (Tulare, according to the map). I personally like seeing what the significant contributors are in any set of data, so how these scholars highlighted these features of what they were inspecting (essentially by laying it out on a neat and colorful dashboard) really appealed to me.
(Also, I’m just throwing this out there for anyone else who’s interested: There’s an online album composed of similar photos from this time period captioned: “These vivid color photos from the Great Depression and World War II capture an era generally seen only in black-and-white.”)