I begin by analyzing the dataset, All City Departments by Payroll, which includes the following data types: Department Title, Year, Job Class Title, Projected Annual Salary, Q1 to Q4 payments, Payments over Base Pay (Including Bonuses and Payouts), % over Base Pay, and Total Payments. There are 56 total records within the dataset, to match the number of departments in City Hall. In understanding the dataset, a few discrepancies and inconsistencies were noted. For instance, they summarize the dataset as “Payroll information for all Los Angeles City Departments since 2013. Data for calendar years, updated on a quarterly basis by the Los Angeles City Controller’s Office.” However, the datasheet only includes information from 2015 and no other year. Next, the category “Job Class Title” seems to be mislabeled. Every other category has a description attached and appears to be self-explanatory. The “Job Class Title” section, on the other hand, consists of numbers rather than any title names. After double checking with the affiliated dataset, “Payroll by Job Class” which utilizes the same category name to describe position names, I concluded the section was mislabeled and instead indicated total number of employees in the department.
After reading through Wallack’s and Srinivasan’s analysis on ontologies, I determine the dataset to be a ‘meta-ontology’ or a state-created information system rather than a community ontology representing local needs. This is apparent by the mission of the collecting agency, City Controller’s Office, along with their choice in categorizations and descriptions used. For instance, they describe the Projected Annual Salary in terms of Budgeted Pay Amount, used for pension contribution calculations indicating the purpose of this dataset is for budgeting and administrative efficiency purposes rather than to represent any community concerns. As a result, there is significant information loss due to the mismatch between this meta-ontology and the community ontology it could have been.
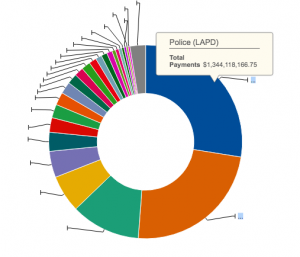
Although this meta-ontology is most useful governing and administrative bodies, the dataset is accompanied by a visualization portraying outcomes that would be of interest to local communities. The chart (as shown below) reveals that the Los Angeles Police Department has the highest payroll expenses. I can imagine various local community groups utilizing this information to further advance their mission or advocate for certain reforms. For example, some groups or public servants may utilize this information on LAPD to highlight how the city prioritizes public safety while other groups may interpret the information as an example of how tax money is being spent on over-surveillance of communities rather than other services, such as health and human services.
However, while this state meta-ontology includes data of interest to the public, there is a huge information loss and does not depict the full picture – allowing for manipulation of data as depicted below. For the information to be of most use, I would expand from the budget and administrative viewpoint in collecting data to one representing community ideals. The current status of the dataset makes it difficult to make any judgments for why payroll in certain departments is significantly higher than others and what this means for individual employees. To counteract this, I would include information such as: average employee salary; largest income discrepancies between employees of the department; demographics of employees including ethnicity, gender, experience and education level; percentage of payroll paid by tax dollars; and historical trends in payroll expense and number of employees to represent any significant increases or decreases by department. Including such information would make the dataset more relevant to community groups who want to analyze the social and economical outcomes of payroll expenses.
After reading various blog posts, I feel like a common theme is that a lot of human voice is missing from these data sets. The data sets, for the most part, all seem to group the businesses into one big group or only look at them as businesses rather than businesses that may be in different areas and composed of diverse people. I guess it would be difficult to include all the information that may set each businesses apart into each data set but, for this data set, like you were saying, including those additional information would help us get a better picture of the data set we’re looking at- which in return would help people make better analysis and decision when using this data set.
Great post! I too noticed that many of the datasets claiming to go back to a certain year failed to do so… It’s only right that more information be included to justify the differences in payroll expenses. I enjoyed your interpretation of the data in regards to the LAPD having the highest payroll expenses, which can be used to support two conflicting arguments. I think that the meta-ontology should remain for the purposes of the state and a separate community ontology established to highlight issues important for that community, therefore retaining efficiency.