I chose to reverse engineer the Photogrammar, a database created by a team of seven digital humanities at Yale University. This website employs multiple digital techniques to reorganize, visualize and analyze the photography collection by several unit photographers to document the political, economic and social life in the U.S. from 1935-1946.
The 170,000 photographs, also collectively known as “The File” or “the FSA-OWI File”, displays the realistic moments during the Great Depression and Second World War in the States in order to support for and justify government programs. From sign and ticket window of a large dance palace in Hollywood (See Photo 1) to Japanese immigrants in Los Angeles, from desert in Arizona to snow scenes in Boston, from political assemblies to children playing on the streets, more than ten thousand images of different subjects in those photographs offer a rich visual history in the U.S. during the chaotic historical period. Originally created by United States Farm Security Administration and Office of War Information (FSA-OWI), the collection is now preserved in the Library of Congress. However, this online database offers a more accessible and interactive approach for the public to view this historical source.
.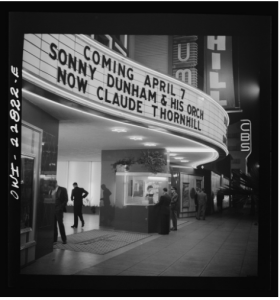
(Photo 1. Photo courtesy: Russell Lee, April 1942. Photogrammar. http://photogrammar.yale.edu/records/index.php?record=owi2001024138/PP. Accessed Oct 3, 2016)
To process the source, the digital humanists first scanned and digitized the photos. Then they tagged and categorized the photos by location, by photographer and by date. Since the photo collections have been processed by Paul Vanderbilt from FSA-OWI with his “Lot Number System and Classification Tags System” in the 1940s before scholars at Yale developed the online database the website now incorporate and enrich Vanderbilt’s system when processing the data.
After describing the features of each photo the digital humanists geocoded approximately 90,000 photos on maps of the U.S. counties and made the maps reflect different photographers and changes of the historical period. As one core feature of the website, the map below is one of the maps that indicates different photographers’ routes and activities in different locations of different dates. (See Map 1)
Third, in the “Treemap” button of the “Photogrammer lab” section, photos are classified under different levels by subject matters while “Metadata Dashboard” button analyzes the correlation between date, county, photographer, and subject. Even though this dashboard only provides metadata for one individual state, namely California for now, its development is very promising in terms of examining how different factors participated in the project.
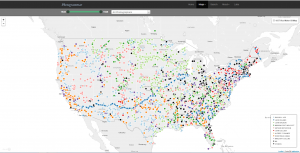
(Map 1. Photogrammar, http://photogrammar.yale.edu/map/dots.php. Accessed 3 Oct., 2016.)
This database platform presents the processed the data in a user-friendly manner. Once you read the “About” and understand the purpose of the whole project a wide array of options in “Search” can easily navigate you to your desired contents. Themed by location and authorship, two different map options under the “Maps” button visualize and match the photos with the dates, locations and individual photographers. The homepage (See Homepage 1) also welcome random netizens to begin with the “start exploring” button to the map and to grasp the significance of the database with the three buttons at the lower part.
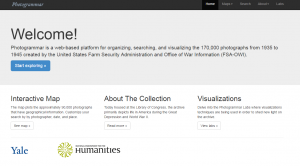
(Homepage 1, Photogrammar. http://photogrammar.yale.edu/. Accessed by 3 Oct., 2016)
Supported by Leaflet and CartoDB, this database is a stimulating tool for audience especially scholars working in the field of U.S. political history, art history and media studies.
It’s interesting how Photogrammar builds upon Paul Vanderbilt’s FSA-OWI “Lot Number System and Classification Tags System” from the 1940s. This goes to show that as technology advances, digital humanists can revisit old research projects and upgrade the media used to present the information in order to meet contemporary standards (or even surpass them). Fortunately, the current format of Photogrammar is malleable and modular, enabling researchers to add more data to the archive and improve upon its design.