I chose to analyze the data set “Budget vs. Actuals” by the LA Controller’s Office. This dataset allowed me to compare the budgets allocation for each Department’s expenditure accounts to their actual expenditures. The data types for this dataset include the Budget Fiscal Year, the Department Name, the Total Expenditures (in dollars), the Total Budget (in dollars), and the Account Name. In this data set, the budget fiscal year is 2016. The fiscal year for Los Angeles is July 1 2015 to June 30 2016.
These data types create a record that aims to highlight the disparity between a department ’s budget and expenses. It aims to exemplify how money was meant to be spent, and how money was actually spent. Each record includes the budgeted dollar amount per department , and then the actual money spent by each department . It shows us how careful some department s are with money and how careless other department s are with money. Because we all live in LA, this dataset is personal to us as citizens because a lot of this money being spent comes directly from taxpayers.
In “Local- Global: Reconciling Mismatched Ontologies in Development Information Systems,” Wallack and Srinivasan define ontologies as data systems that “essentially share infrastructure for individuals to function as a group”(Wallack and Srinivasan 1). In other words, ontologies serve as a link between different groups and between the group and the individual. Ontologies also “work to create and enact worldviews within the social group and situate knowledge within the organizational or community setting”(Wallack and Srinivasan 1). The dataset which I chose to explore portrays an ontology pertaining to the budget vs. the actual spending of various departments within Los Angeles County. This ontology would be classified as a meta- ontology because it is created by the state, yet the data is very confusing to read and understand by the ordinary citizen. It took me a while to figure out how to use and understand the data because there were a lot of confusing terms for people not involved in finance.
Because of this, this ontology makes the most sense from the point of view of a city official responsible for creating budgets for various departments within Los Angeles. This person would examine this ontology to determine which department should have more or less money in the budget, and adjust budgets for the following years accordingly.
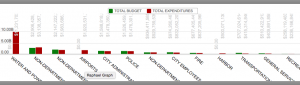
This dataset does a great job at portraying visually the disparity between the budget and actual spending of each department within Los Angeles. It tells me that many departments either have no care about the money they spent, or had extenuating circumstances which forced them to spend a lot of money they didn’t have. For example, the biggest disparity between budget and expenditure is from the Department of Water and Power. They spent $11,231,703,314.55. Their budget was $0. This enormous spending of money is confusing- why did they spend all that? Why was their budget $0 to begin with?
Wallack and Srinivasan argue that, “While any group’s ontology is unlikely to match that of every individual within the group, the extent of mismatch tends to increase with the scale of the group and the differences between the purpose of individual and group ontologies” (Wallack and Srinivasan 2). Specifically, the meta-ontologies created by the states lose a lot of local context and important information pertaining to individuals and district communities. The ontology loses its humanity- it becomes a record that is so broad and vague that individuals lose their voices in it. It only illuminates a small department of the population and leaves out a lot of individual voices. In terms of this specific data set, the most important component of this ontology which gets left out is its relationship to the individual. We have no information about how this spending and over- spending of budgets directly affects the individual. Perhaps because so many department s over spend, the individual tax rate goes up, causing financial stress and burden on many individuals. Furthermore, another huge question that I have after examining the data set is where does the money come from that the department s have over- spent? Because so many department s went way over their allocated budget, where did they get this money from?
From the point of view of a government critic, I would use this dataset to highlight the incredible amount of spending that goes way over the budget prescribed to each department . There has been a tremendous loss of money by many of these departments- money that was not even allocated to them in their budget. I would ask where this money is coming from. If it didn’t come from their budget, where did they get it from? Are they contributing more to the debt that the state is in, or are they using money from other budgets or places that the public is unaware of? I would view this ontology with a critical eye- I would think that many departments in Los Angeles don’t know how to manage and balance their spending and I would assume that the county is in great debt because of it.
It was interesting reading your post because I had also analyzed a data set related to budget. Similar to this data set, mine also had very individualization, which I thought was kind of disappointing. I would definitely ask the same questions as you and would agree that this type of data set would be suitable for people who care about the numbers. In addition to what you have stated, that the city official creating budget plans would be the most interested, I feel like when creating these budget plans, they shouldn’t just look at the numbers but get a better idea of how the businesses are using the money to help allocate the budget. Knowing the intentions behind what they would use the money for would be also an important information.
Great analysis and interesting dataset! I agree that besides noting the departments that overspend, the dataset provides very little value to the community and is more geared towards government officials and leaders dealing with budgetary and administrative duties. I think your comment on the dataset ontology losing its humanity was particularly interesting because the goal of having the data open by the City Controller’s office is to inform the public, yet the data is presented in a way that is unrelatable by the people. There is no information on how much of the budget is directly tax money, what projects the money is being spent on, what specific categories of spending went over the budget, etc. Lastly, I wonder if the $0 budgeted for the Department of Water and Power was correct or a discrepancy because I actually found a couple inconsistencies in the dataset I analyzed as well.