A team of seven professionals and scholars hailing from Yale University contributed to compiling hundreds of thousands of photographs dating back to World War II and the Great Depression into a project titled Photogrammar. Having originated from such a serious period of time, these iconic photographs vividly depict the poor living conditions, effects of the war, and hardships that Americans endured during the 1930’s and 1940’s.
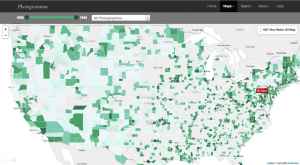
Photogrammar, as seen above, organizes, details, and visualizes information collected from the United States Farm Security Administration and Office of War Information in the form of an interactive, well-organized (thanks to the cataloguing system created by Peter Vanderbilt) map made web-accessible (and therefore publicly-accessible). From this map, we see regions in the United States with varying shades of green; a dark forest green color indicates that a high volume of photos was taken in that county in that state while areas with a mint green color are counties in which a small amount of photos were captured. Furthermore, based on what areas of the United States have the darkest shades or lightest tints of green, we can extrapolate what parts of the country experienced the most or the least events and, by using the cataloguing system (essentially filters such as “Lot Number” and “Photographer”) created by Peter Vanderbilt, we can determine whether these photographs captured moments that were related to war, the social lives of Americans, or the development of land.
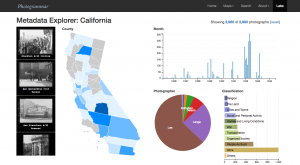
This project also provides this interactive dashboard showing what photographs were taken during which year, in what county of California, and by what photographer as well as what classification tag they fall under. Even though this feature is only available for photographs taken in California, I like the way data is visualized here better than in the United States map above. On this page, you can clearly see who the prominent photographer was (Russell Lee, according to the pie chart), what the most common subject of the photos was (work, according to the horizontal bar graph), what year the most photos were taken (early 1942, according to the vertical bar graph), and what region of California had the highest volume of photos (Tulare, according to the map). I personally like seeing what the significant contributors are in any set of data, so how these scholars highlighted these features of what they were inspecting (essentially by laying it out on a neat and colorful dashboard) really appealed to me.
(Also, I’m just throwing this out there for anyone else who’s interested: There’s an online album composed of similar photos from this time period captioned: “These vivid color photos from the Great Depression and World War II capture an era generally seen only in black-and-white.”)
You really have to love this project! There’s just so much there. Can you imagine how you might use it in a research project?
I believe you did a good job introducing the project and expressing the significance of it and the point that the creators were attempting to convey. Additionally, I though the way you detailed the sources that the creators of this DH project used and how they were appropriate for providing information for the topic of the project was well done. The only point of critique that I have is that parentheses and interjections into the natural flow of your writing are overused. A lot of what you had to say in the parentheses was interesting and could’ve been used somewhere in the blog post, but, putting them in the middle of sentences, the post became hard to understand at some points.
EDITED:
I believe you did a good job introducing the project and expressing the significance of it and the point that the creators were attempting to convey. Additionally, I though the way you detailed the sources that the creators of this DH project used and how they were appropriate for providing information for the topic of the project was well done. The only point of critique that I have is that parentheses and interjections into the natural flow of your writing when you are describing how the creators presented their findings are overused. A lot of what you had to say in the parentheses was interesting and could’ve been used somewhere in the blog post, but, putting them in the middle of sentences, the post became hard to understand at some points.
I really enjoyed this post! It was easily understandable, well-written, and organized. I also appreciate that you gave your input of what you personally thought and the additional site you linked. I think it was a good idea to further explain your idea of why they used certain processing methods and presentations to present their ideas and objectives.
Your post really outlines the ways in which the web-accessible mapping system contributes and expands the ways we can read a set of information, in this case, a catalogue of American life in the 30s and 40s as seen in photographs. The inclusion of what you found appealing about it and why also gives the reader a view into another way of reading the information available. Good stuff!
I also really enjoyed how the creators of Photogrammar chose to present all of the metadata together on one dashboard for California. As I said in my post, I think it gives a really good sense of “who was doing what, where” which gives the user a nice wholistic view of this time in California’s history. Well done!
I find any historical project relating to WWII so interesting so this project definitely drew my attention as well. I think that because this time period is so intense and heavy, the website is able to stay so clean and simple which you showed us in screenshots of the website with a white, easy background. I love the two screenshots you shared with us, I think that the map of the United States is the most interesting part of the website so I like that you shared that with us as well as a detailed look at California, its interesting to see it in comparison to other regions of the United States.
Since the project focused on the entire country and the visualization was a bit overwhelming with data, I enjoyed how you broke down the visualization to clearly explain its elements, for example, what the colors represent and could indicate about the occurrences of events in specific regions of the country. I also appreciated you including your opinions about the interactive dashboard in the blog because it shows what worked better for viewers exploring the project.
I agree with you! I thought their Lab on California was much more informative (and better designed) than their main visualization, and much more fun/intuitive to poke around on. Although, did you get a chance to see their other US map visualization shown via dots? It provides a lot more information than just the gradient density about photographers and their movements across the country.
Great job breaking down the fundamental structure of the site! I found it really helpful for myself when exploring it. I also really enjoyed the link supplied at the bottom. It is really interesting how our conception of the past is based on documentation of it, And how something as subtle as a picture being black and white or in color alters our perspective of our history. Nice touch!