We’ve learned to make a map in Tableau, and we’ve learned how to filter and sort points. Tableau can actually do quite a bit more than that, though.
Your last dataset included longitude and latitude information. But Tableau includes its own geocoding capabilities — that is, it can assign latitude and longitude coordinates based on addresses.
Tableau can also import basemaps from other servers, which you can use as an alternative to Tableau’s built-in default map. You might do this if you find a map that includes data you want to work with, or if you’d like to see your data displayed on a historical map.
Because I want to show you some of Tableau’s capabilities for working with US data, we’ll use a new, US-based dataset this time. This CSV contains a list of art museums in the United States. It’s derived from a set produced by the Institute for Museum and Library Services. The dataset’s documentation may be useful for deciphering field names and data types. (I sneakily removed the latitude and longitude information because I wanted to show you Tableau’s geocoding capabilities!)
Open Tableau and connect your data
You should be used to this by now! As before, select Text file, since we’re working again with a CSV. Once you’ve connected the dataset, you can go to Sheet 1 by pressing the orange button at the bottom of your Tableau window.

Inspect your data
Although our dataset contains multiple kinds of address data (because sometimes museums have multiple locations), we’ll use the address that corresponds with the museums’ physical locations. Those dimensions are prefaced by a Ph. They include Phcity, Phstate, Phstreet, and Phzip.
If you scroll to these dimensions, however, you can see that we have a small problem: Tableau has identified these dimensions as text fields, not geographical information. You can tell that because the tiny icon to the left of the dimension names is an Abc, not a globe. We will need to tell Tableau that these dimensions consist of geographical information.

Change the data type
To change the data type from text to geographical information, click on the tiny Abc icon. From the dropdown menu, first select Geographic role and then select the corresponding location type. For example, for Phstate, I’ll choose State/Province. Do this for each of the “Ph” dimensions.

But wait! We have a problem!
If you try to assign a geographic role to Phstreet, you’ll find that no role exists for “Street.” Why? That’s because Tableau geocodes locations only to the level of zipcode — not street address!
So if you want to locate addresses more precisely than zipcode, you’ll need to import latitudes and longitudes directly into Tableau. You can find out more about geocoding addresses to street level here.
For now, leave Phstreet as it is. We’ll confine ourselves to working with Phstate, Phcity, and Phzip.

Assign a geographic hierarchy (1)
When you have locations at various “levels” (e.g., state -> county -> city -> zip), it’s easier to work with this data if you assign it a hierarchy.
To do this, right click (control-click on a Mac) at our “top-level” address information — that’s Phstate — and from the dropdown menu, select first Hierarchy and then Create hierarchy. Then you’ll need to give your hierarchy a name. I’ll just call mine “PH Hierarchy.”

Assign a geographic hierarchy (2)
Scroll down your list of dimensions until you find the hierarchy you just created. (The dimensions are in alphabetical order, so it may have jumped around a bit.) Once you’ve found it, drag first Phcity and then Phzip into the hierarchy.
Now your levels are arranged in order!

Map your points
Now that we’ve made our hierarchy, let’s get our points on a map. Start by double-clicking Phstate. Voila, your map appers, with geolocations supplied by Tableau!

Fix uncoded locations
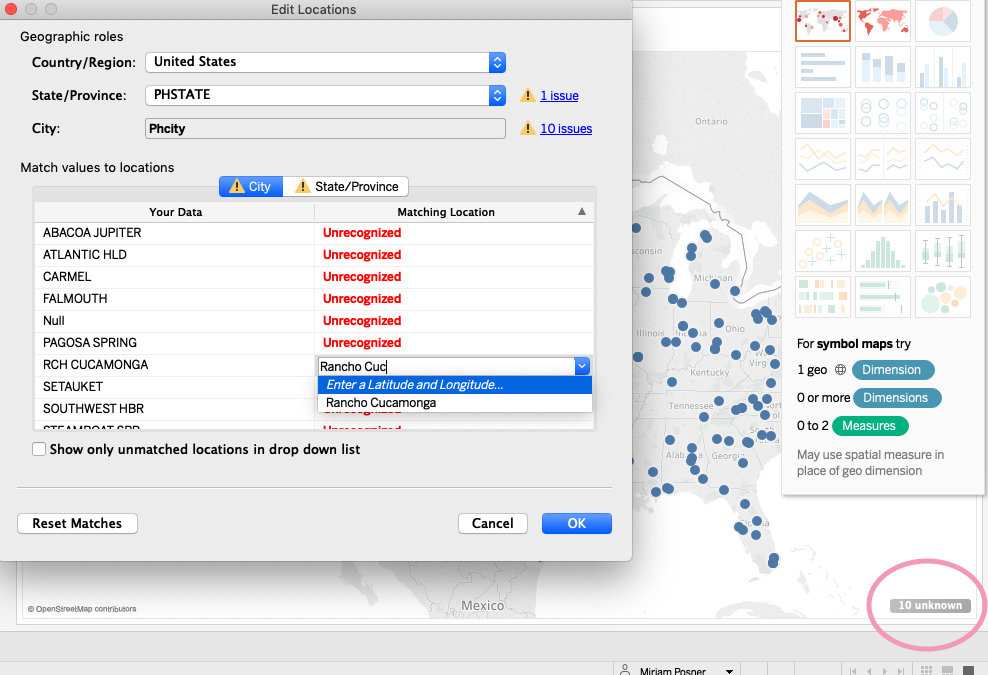
Your map looks great, but if you peek at the lower left-hand corner you’ll see an ominous gray box that tells you about some number of unknown locations. (Your number might be different from mine, since I’ve cleaned up a few already.)
This means that there were a few locations that Tableau could not geocode. To find out more, click on that gray box and then click on Edit locations.
You’ll see a list of cities for which Tableau could not discover coordinates. If you double-click on the red text that reads Unrecognized, you’ll find that you can edit the location. See if you can find some locations that you can fix. When you’re done, click OK.
Drill down your hierarchy
Now points mark each state included in our data, but let’s drill down to zip codes. Click on the tiny plus sign within the Phstate dimension (within the Marks pane). Phcity emerges! If you click on Phcity‘s plus sign, Phzip emerges!

Combine your data with other information
Now that we’ve mapped our points, let’s combine that data with some other data about the places where the museums are located. Tableau supplies a number of these layers.
To access them, click on Map, an item in the top menu. From the Map menu, select Map layers… A new pane appears on the left of your Tableau window.

Add a data layer
In the Map Layers pane, you’ll find a Data Layer section. From the dropdown menu, you can select from a range of US Census data. Select a layer that interests you, and you’ll see it displayed on your map, below your points.

Add a new basemap (1)
These data layers are very useful (particularly if you’re working with a US-based dataset!), but you may find that they don’t serve your needs. In that case, you might consider replacing Tableau’s basemap with one that supplies the information you need.
A number of services (“geoservers”) provide these basemaps. For a basemap to work with Tableau, it needs to be supplied in the WMS (Web Map Service) protocol. I’ll add some options to the Mapping Resources page on our website.
For now, click on the Map menu item. This time, click on Background Maps and then, from the dropdown menu, select Map Services.

Add a new basemap (2)
We’ll now provide Tableau with the URL of one of these WMS geoservers.
In the Map Services window, click on Add… and then select WMS servers…
In the box labeled URL enter the following URL: https://tigerweb.geo.census.gov/arcgis/services/TIGERweb/tigerWMS_Current/MapServer/WMSServer
This URL links to map layers supplied by the US Census containing data from the American Community Survey.
When you’ve entered the URL, click OK and then close the Map Services window.

Add a new basemap (3)
Your basemap has disappeared! That’s because Tableau knows you want to replace it with one of your own. In the Map Layers pane, you’ll find a range of options containing data drawn from the American Community Survey. You can select the layers that interest you.
(Some of the options will not appear on your map at certain zoom levels or regions; you’ll probably need to experiment a bit.)

You’re done!
You now know how to create a map, style and filter the points, geolocate addresses, and switch out basemaps! Phew! Not bad for an hour and a half!
Now publish your map or start a new one! If you’ve finished early, you might like to take a look at some other mapping tools.
