Week 9: 3D Modeling- History and the Sims

I was very interested in the development of three-dimensional simulations. At UCLA, the development of the utilization of digital technologies was focused on the historical simulation of Ancient Rome. Unlike Google Earth, which we examined last week, these virtual simulations had to be created completely from scratch because no one has photographs or videos of Ancient Rome, like they do of the modern Earth. Although some sub-par creations were made first, the author says that they had to make serious changes to the original model to make it more accurate and user-friendly. The first phase of this makeover was the formation, data aggregation and interrogation of process. Firstly, this was difficult because people wanted to watch the projections like a movie but the scholars were more focused on accuracy than entertainment. With accuracy they focused on making the quality of the images uniform, and then even trying to make the buildings accurate in terms of both size and time. The second phase was the geo-temporal interrogation and increased kinetic experimentation. This meant continuing to build upon what had already been created and making it accessible for other scholars to join in as well.

Reading this article, I was so impressed by how recently all of these programs had been created. Looking at the images in the article, I was reminded of some of the buildings I had created while playing Sims when I was younger. The Sims game is a popular computer game, in which the player can essentially create a virtual reality. In my Sims games I would not only create people, but also create houses, parks, and whole towns. I didn’t realize it at the time, but this software, that was so readily accessible to me, had made it possible for me to create a 3 dimensional world. Although I had not been thinking about these towns in the historical sense, I realize now that with this software I could have created my own, somewhat inaccurate, Roman town, or any other time period for that matter.

With this realization, I now wonder which aspect of the 3-D modeling was utilized first. I wonder if the technology was first used for commercial purposes or educational purposes. This means, for example, whether these games were created in the model of programs created for historical purposes like this one, or the idea for historical models came from the ideas of computer games.the-sims-4-build-mode-house-2jpg-9589a6_1280w

Week 8: Interface Design and Apps

When it comes to any digital platform, an extremely important element is the interface design. In the reading by Ben Shneiderman, her explains the “Eight Golden Rules of Interface Design”. We already know that design is important when it comes to the digital platform of the internet and websites.  Although the interface design of websites is that we will be more focused on in this class, something else I find interesting is the interface design of apps.  In today’s modern world, all of my peers have smartphones that they rely on.  On these smart phones, especially the iPhone, there are built in apps and supplementary apps that can be downloaded.  These apps must be designed to be user friendly and therefore follow the eight golden rules of interface design.

An example of an app that is extremely popular, and therefore must have a good interface design is Instagram.  Almost every person I know has an Instagram, and although I’m sure it can’t account for all of the success, I am sure some of Instagram’s success can be attributed to a successful interface design that is easy for users to operate. The first golden rule is to strive for consistency. An example of a way that Instagram maintains consistency is that all pictures are presented in the same format.  It is very easy to see when a picture was posted, and by who because it is always displayed in the same way. The second is to enable frequent users to use shortcuts. Something that could be considered a shortcut is that instead of looking for a person’s picture on the newsfeed, the user can also type in and search a person’s name if they know it. The third is to offer informative feedback. The main source of feedback is the number of likes and comments which lets a person know how popular their picture is.The fourth is to design dialog to yield closure. The dialog to yield closure is the loading bar and then check mark that signal a photo has been successfully uploaded. The fifth is to offer simple error handling. An example of these simple errors that can be handled are spelling errors that can be corrected with autocheck. If there is a simple spelling mistake in a caption it will often be identified. The sixth is to permit easy reversals of actions. . If something is posted accidently, or the person changes their mind it is very easily to delete pictures or comments from Instagram. The seventh is to support the internal locus of control. The user is the one in control of the actions because they are given the tools to edit the picture and post it how they want it to look. Finally, the eighth is to reduce short-term memory load.  The simple design of Instagram with the one main feed that can be scrolled through is optimal to reduce short term memory load.  Users can open Instagram and just scroll until they reach a picture they have already seen.  Once they reach that picture they will know they have seen all of the new pictures.

http://instagram.com/

Week 7: Mapping and GIS

This week I very much enjoyed reading Introduction to Web Mapping. In Spring 2014 I took Geography 7, Introduction to GIS, here at UCLA. I really enjoyed this class and hoped to incorporate some of what I had learned in that class into what I was creating for my digital humanities project. Although I had at least heard most of the information in the lesson, it was a very good refresher.

In Geography 7, I learned the basics of QGIS and created a new project each week, and they continued to get hard and harder as the weeks progressed. By the end of the quarter I was able to make a project that I was extremely proud of. In this project I had downloaded a map with all of the voting districts in California and chose on in the Los Angeles area to focus on. I then found the voting information from the 2012 elections. After linking this information to the map, I was able to create many versions of a static map. These included maps based on results from the 2012 General election in terms of voter registration, voter turnout, and voter political preference. With this information, I then created maps that showed precincts to either target or avoid when campaigning in an upcoming election, based on my earlier previous maps.

At the time of creating these maps, I didn’t refer to them as static web maps, but after reading this article, I realized that is what they were. In addition to being static though, these maps are also personalized because, although the data collected represents a snapshot in time, I created the color scheme, classification method, title, legend, scale bar, and other aspects that can be created in QGIS.

The most new information for me, involved the history of Internet mapping because in Geography 7, we had mostly focused on how to actually map. I am constantly impressed by virtual map technologies like Google Earth and Microsoft’s Virtual Earth, so it was incredibly interesting to see how these systems developed. It is hard to believe that this many steps in virtual mapping have been made in the only 21 years since the first Internet map viewer was produced in 1993. Although I don’t understand the coding being referenced in each of the progressions from generation to generation, I can understand, in words, some of the capabilities that were developed. I am very excited for this week because we will be talking about something I am at least slightly familiar with and eager to help my group with that.

Below I included some examples of the maps that were included in my Geography 7 class that I described.

FinalMap3 FinalMap4 FinalMap5 FinalMap7

Week 6: Networks and Social Networks

For week 6, I particularly enjoyed the reading about Demystifying Networks. In this blog entry, Scott Weingart laid the groundwork for understanding networks.  Although I had an idea of networks before reading this article, there were definitely some elements of networks that I didn’t really understand, so just ignored.  The detailed post explained each level of the network.

Scott explains that a network is made up of stuff and really any stuff.  Each item of stuff is referred to as a node. These nodes are then divided into different types of nodes. For example titles of books and authors of books would be two different types of nodes.  The relationships between these nodes are referred to as edges.  He explains that a key to these edges functioning properly is that edges can only connect two different types of nodes and not nodes of the same type.  There are also two different types of edges that can connect the nodes.  A directed edge describes the kind of edge, with which you cannot swap out Node 1 and Node 2. The other kind, unsurprisingly, is an undirected edge.  With an undirected edge, Node 1 and Node 2 can be interchanged and are connected with a simple line.

When I think of networks, I immediately think of social networks. As a “millennial” our lives are completely intertwined with social networks.  Most of our interactions are even through social networks like Facebook or twitter.  After reading this article, I tried to relate it to what I believe is the most notable social network: Facebook.  It was easy for me to identify that people were the nodes, so in Facebook terms, each profile would be considered a node.

I determined that although Facebook is a vast and complicated network.  In the terms that I had just learned, I could only make sense of Facebook as a unimodal network. If Facebook mainly just contains simple connections between one type of node, each friendship would be considered an edge.  Because there is so much more that goes into Facebook, I was confused that there were not more types of edges, and that I couldn’t see it as a multimodal network. I thought of the different groups that were made on Facebook and how that could be displayed visually without being confused for friendships.

I can see how people on Facebook, if not connected by friendships, could each be connected to the groups they belong to, in a multimodal network. This would form a very interesting web, but only be illustrating the group aspect of Facebook, and disregarding the friendship aspect.  Overall, I am excited to have made progress understanding networks, and although I believe I could make interesting specific networks relating to real life, there are still many things I don’t understand about the networks I interact with in daily life.

Facebook

The Real Face of White Australia and Ancestry.com

Screen Shot 2014-11-02 at 5.32.38 PM

When I attempt to explain digital humanities to my friends who ask about it, I simply say it is learning how to bring the humanities into the modern, digital world.  I tell them it is a way to represent history, literature, and art, among other things, on digital platforms like websites.  “The real face of white Australia” was a great example of a digital humanities project I might show my friends as an example because it was clearly presented and brought to light a part of history that is not commonly known.

Before exploring this website, I had always thought of a country that was home to Aborigines, much like our Native Americans, and then settled by white, British settlers. I had thought there must have been some cultural diversity in Australia of course, but it never occurred to me that there would be a large Asian population, despite knowing how close it is to Asia. One of the things that makes this presentation so interesting and compelling is that instead of presenting merely the statistics about what races were living in Australia, the images of the documents were presented.  Being able to click on and see an actual document from so long ago is something really special about digital humanities projects.

Another website that I believe represents the field of digital humanities well is one of my favorite examples to give people when I explain the field of digital humanities. This well known website is Ancestry.com. Much like the historian researched the historical records in Australia to learn about the diversity, I have been able to research my own family history through records on Ancestry.com. I did a free trial of Ancestry.com today to test it out and was very impressed by all the information I could see after just entering my email.  For example, I found my grandfather and his family’s record in a census pictured below.  Having the image of the handwriting really brings the history to life.  It would have been very cool if pictures were also included on Ancestry.com, because I am sure that is possible after seeing how they were able to use pictures on “The Real Face of White Australia”.

Projects like these are some of my favorite because I am so interested in history, but also appreciate how digital humanities can benefit the public when shared on the internet, and not just the people that study the specific topic.  With digital humanities, anyone who is even slightly interested in the topic can benefit from the project.

Week4: Graphs and Charts

After spending so much time and focus on metadata, I believe I have a pretty good understanding of it. Now it was interesting to read the book about the presentation of data, using this metadata we have just studied. Talking about data can often be very confusing, but the food preparation analogy, made things a lot clearer and helped me to understand what each step was, and how it contributed to the overall data representation. Of all of the steps, I found the section on visualizing the data to be the most interesting.
I have made many charts and graphs in my time, and am sure I will continue to make even more in my time in the digital humanities minor, as well as in the future, so I am sure that these tips and tricks given in the data visualization section will be very helpful. Most of the information in Chapter 14 “Anatomy of a Graphic” were tips that I had heard before, but the one thing that really stood out was the point about not cluttering a graph. When trying to make a graph informative, I do have the tendency to over-clutter it, because I worry I am not putting enough information on otherwise. Although this was a point I am very happy I have addressed now, the chapter that I was extremely interested in was Chapter 15.

In Chapter 15, the subject was the importance of color, fonts, and icons. I had always enjoyed playing around with colors, fonts, and icons when making visual representations of information, but I had not realized how important these aspects actually are. One of the first things that stood out to me was that they acknowledged that color is important, but stressed that the data must first all be laid out before adding color. Another idea that was extremely interesting to me and I hadn’t thought about before was the importance of white spaces. When showed the comparison between charts and graphs with white margins and those without, I was impressed by how much cleaner and clearer the representations with margins looked. With this knowledge I decided to search the internet for interesting graphs that depicted some of the techniques I had just studied.

image001-2This is an example of a representation that did not use color well. There are no color differentiations between any of the descriptions near the top, which makes it confusing to understand. Although this is a silly chart, it shows a confusing example of the point the person is trying to make, because of the coloring of the image.
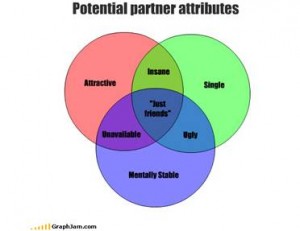
image002This other fun chart is clear, because color is utilized to show overlap in the graph and differentiate between attributes. In this visual representation, the color only benefits the representation.

Week 3: Netflix and Metadat

The article about how Netflix reverse engineered Hollywood was extremely interesting because not only was it relevant to what we have been learning about in class, but also to my everyday life. I love watching Netflix and most of my friends do as well, but most of my friends do not have the insight into Netflix categorization and metadata that I do. I have noticed the extended categories on Netflix before, but didn’t make the connection that this was metadata until reading this article. It makes sense that they want to categorize the movies as specifically as possible.

One of the first things the article mentioned that we talked about in class was the use of controlled vocabularies. In order to correctly categorize movies, they had to pick certain words and phrases to use and orders that these words should be put in. The article spends a lot of time dissecting the controlled vocabulary of the lengthy category descriptions and figuring out how all 90,000 categories were formed. It turned out that this metadata was not all of the metadata that was used for categorizing the movies, and actually not even close to scratching the surface. When the author met up with the man that made the actual categorizations it became apparent that the metadata that went into making the classifications was much more complicated than some controlled vocabulary tags. This metadata was made up of categories that rated each movie on its main characters, romance, likeability, and main actors. All of this metadata makes up what is chosen for the public metadata categories.

This metadata is what makes Netflix so successful at not only keeping subscribers, but also getting new ones. It makes sense that they would advertise similar movies next to movies that people are watching and appeal to what people want. Most people already understand this, but another thing I learned from this article is that more surprising is that they use all of this information also when they are creating shows. Wildly successful shows right now such as Orange is the New Black and House of Cards were created by the people of Netflix that have already been studying what people want. Through these shows they give people elements of television that they have observed as the most popular. After learning so much about Netflix’s system of categorization through metadata, I am very curious to learn more about the metadata of my other favorite websites like Facebook, Spotify, and Pandora.

Netflix Home Page

Week 2: Metadata and Collecting Information

http://www.businessweek.com/articles/2013-06-12/what-if-the-redcoat-nsa-had-access-to-paul-reveres-metadata

http://www.ibtimes.com/spying-celebrities-nyc-taxi-metadata-exposes-celeb-locations-strip-club-clients-1696744

I was directed to this very interesting article from another about NYC taxi metadata exposing personal information about celebrities. The article featured in Bloomberg Businessweek technology section also relates to metadata and people’s personal privacy.  Although it may seen more abstract than actually hacking and reading emails, the collection of metadata is almost equally invasive.  Meta data is comprised of five categories that help to describe the types of metadata.  These categories are administrative metadata, descriptive metadata, preservation metadata, technical metadata, and use meta data.  All of this information about a certain set of data can help someone reveal the big picture about the data without actually being given the data.  Large amounts of metadata can be easily processed through computer algorithms and then analyzed.  Because so much data can be put into these large computers, there is essentially no limit to what the data can uncover.

Although this can seem alarming, other people argue that there should not be concern with all of this data being available to the government.  Many people believe that if the government does their job and doesn’t overstep their boundaries, it will truly be in place just to protect us.  Also other people argue that the only people that have to be concerned with being monitored if they are doing something illegal.  I disagree with this, basing my opinion off of all of the hacking I have seen recently in the media.  Although I know that hacking  pictures from celebrities is very different from gathering legally obtained metadata, there is still a certain sense of creepiness associated with anyone being able to learn information you might not want to be public.

The use of metadata in one of the articles about Jessica Alba and Bradley Cooper to show that they did not tip their cab drivers exposes something they  have done that they did not think people would find out about and are probably not proud of.  Although I don’t think I would be someone that would be of particular interest when it comes to collecting data, it does make me think twice about how much information is known about my calls, messages, and other phone habits.  My cellphone is the devise I use most in my day to day life and access to metadata about its usage would tell a lot about what I do and where I go. This information will not seriously affect my actions in my day to day life, but will make me think twice about not doing anything I wouldn’t want to be tracked and linked to me.