
(Cross-posted on UCLA’s DH Bootcamp blog)
Edit: Dot Porter made a Zotero collection for this post! Thanks, Dot!
Many students tell me that in order to get started with digital humanities, they’d like to have some idea of what they might do and what technical skills they might need in order to do it. Here’s a set of digital humanities projects that might help you to get a handle on the kinds of tools and technologies available for you to use.
I’ve tried to include a few different types of projects, but it’s hard to provide a really representative list. If you’d like to see more digital humanities projects, you can find directories at art-humanities.net and DHCommons.
Here, I discuss:
- a gallery of primary sources
- a digital scholarly edition
- a mapping project
- a network visualization
- computer-aided text analysis
- a historical 3D model
- a longform, media-rich narrative
A Gallery of Primary Sources: Making the History of 1989

What it is
A collection of primary sources related to the fall of Communism in Eastern Europe, accompanied by teaching materials and interpretive essays.
What you’d need to know
- Omeka.org (which forms the basis of the site), or you could use Omeka.net if you aren’t so picky about the way the site looks and acts
- HTML and CSS (optional; to customize the way the site looks)
- PHP (optional; to customize certain site functions, like the way items display)
Get started
A Digital Scholarly Edition: The Willa Cather Archive

What it is
A carefully edited digital archive of the writings of Willa Cather, along with extensive scholarly essays, analysis, and multimedia galleries.
What you’d need to know
- TEI (the markup language designed for scholarly editing)
- XSLT or an XML publication system
Get started
A Mapping Project: The Negro Travelers’ Green Book
 What it is
A searchable map of the addresses contained in the 1956 Negro Travelers’ Green Book, which the user can filter by state or establishment type.
What you’d need to know
- Google Fusion Tables
- Google Maps
- Some JavaScript (to get the map to display properly)
Alternatives
There are almost too many mapping technologies to list, but some popular tools include Neatline (which you’d use together with Omeka), GeoCommons (a relatively simple mapping application), and ArcGIS (used for complex or large-scale mapping projects). If you’re serious about learning to build dynamic web-based maps, you’d be wise to learn the client-side language JavaScript (to control the way things show up on browsers), a server-side language like PHP (to interact with data), and the database language SQL (to manage your geospatial data). More mapping tools.
Get started
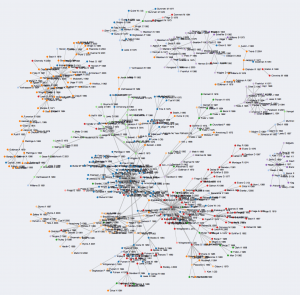
A Network Visualization: A Co-Citation Network for Philosophy
What it is
A visualization of the authors referenced together in a corpus of philosophy journals.
What you’d need to know
- D3.js, a JavaScript library for producing visualizations on the web.
- The programming language Python, for manipulating your data.
- A dataset. This one came from the Web of Science, which allows you to download citation data for academic articles.
Alternatives
You can make network visualizations without (necessarily) coding by using the web-based ManyEyes or the free Gephi or Cytoscape. Other tools for data visualization.
Get started
Computer-Aided Text Analysis: Topic Modeling Martha Ballard’s Diary

What it is
An analysis of a historical document that uses a statistical method called topic modeling to group together the “topics” found in a large set of texts.
What you’d need to know
- MALLET, a Java-based software package for text analysis (including topic modeling)
- R, a programming language for statistical analysis and graphics
Alternatives
The Topic Modeling Tool provides a simpler-to-use graphical user interface for topic modeling, as does Paper Machines (which produces topic models from your Zotero library). But topic modeling is just one kind of textual analysis. Find a rundown of different kinds of text analysis here. Often, people who are new to text analysis enjoy starting with the web-based Voyant Tools. I also like the Lexos suite. More tools for text analysis.
Get started
- Very basic strategies for interpreting results from the Topic Modeling Tool
- Special issue of the Journal of Digital Humanities on topic modeling
A Historical 3D Model: Digital Magnesia

What it is
A painstakingly researched re-creation of the Hellenistic city of Magnesia.
What you’d need to know
This particular model is created using the procedural modeler CityEngine.
Alternatives
The easiest way to create 3D models is probably with SketchUp. Serious 3D modelers often use Maya or Rhino.
Get started
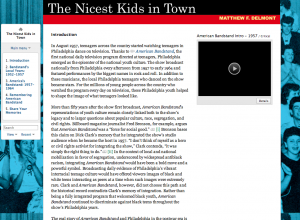
A Longform, Media-Rich Narrative: The Nicest Kids in Town
What it is
An essay, accompanied by photographs, video, and sound, that can be reconfigured by the viewer to be read in multiple ways.
What you’d have to know
Get started
August 30: Post edited to reflect that you don’t need Python to download Web of Science data. Thanks for the correction, Scott Weingart!
87 responses to “How did they make that?”
[…] http://miriamposner.com/blog/how-did-they-make-that/ […]
[…] In the remainder of this post, I hoped to describe in detail the process of bringing tweets from over the past year into a single heat map with interactive (clickable) tweets displaying more information. However, that description ended up 1,000 words long. I would still be happy to post it, should you be interested in reading a long description of the question that Miriam Posner asked best: “How did they make that?” […]
[…] In the remainder of this post, I hoped to describe in detail the process of bringing tweets from over the past year into a single heat map with interactive (clickable) tweets displaying more information. However, that description ended up 1,000 words long. I would still be happy to post it, should you be interested in reading a long description of the question that Miriam Posner asked best: “How did they make that?” […]
[…] Posner’s blog How did they make that? Moretti’s Atlas of European Novel vs. national literary geographies (Ferre, Bartholomew, […]
[…] How did they make that? […]
[…] How did they make that? […]
[…] by Miriam Posner’s “How did they make that?,” DHCommons Journal seeks proposals that provide “procedural descriptions of how to […]
[…] In other related news, this week’s dh+lib review included a CFP for articles inspired by Miriam Posner’s “How Did They Make That” […]
[…] worthwhile), I am more forgiving in academic loops. Miriam Posner’s digest of digital tools, How did they make that?, is an amazing resource. The question of what to learn to make the things you want is persistent in […]
[…] helped to construct the projects. I highly recommend checking out Miriam Posner’s Blog, at miriamposner.com, for those interested in contributing to the online world of digital humanities. Her post has […]
[…] viewed during class was The Negro Travelers’ Green Book, featured on Miriam Posner’s post, “How Did They Make That?” I liked its elegant simplicity and ease of use, as well as its very powerful ability to allow the […]
[…] In this website, you could search a woman by her name, state, office and party. I learned from Miriam Posner’s blog that the use of […]
[…] es una entrada adaptada de “How did they make that?” de la famosísima he increíble Miriam Posner (con su permiso, claro). La adaptación […]
[…] Reading: “Between Bits and Atoms” (ANC, PDF provided); “Embodiment, Entanglement, and Immersion” (ANC, PDF provided); Can Digital Humanities Mean Transformative Critique? (Alexis Lothian and Amanda Philips); Optional: For more on DH methods and making: browse Miriam Posner’s “How did they make that?” […]
[…] by Miriam Posner’s famous “How did they make that?” […]
[…] by Miriam Posner’s famous “How did they make that?” […]
[…] by Miriam Posner’s famous “How did they make that?” […]
[…] to me multiple times. She is Faculty and the Coordinator for UCLA’s Digital Humanities Program.“How did they make that?” is a great post where she goes through several digital projects and maps out what the project is, […]
[…] by Miriam Posner’s famous “How did they make that?” […]
[…] blog about blogs gave me insight into the usefulness of digital humanities while providing me an example of a […]
[…] a gallery of primary sources […]
[…] a network visualization […]
[…] a gallery of primary sources […]
[…] How Did They Make That? http://miriamposner.com/blog/how-did-they-make-that/ […]
[…] How Did They Make That? […]
Hola ,Thanks for this site , many thanks
[…] a digital scholarly edition […]
[…] · http://miriamposner.com/blog/how-did-they-make-that/ […]
[…] · http://miriamposner.com/blog/how-did-they-make-that/ […]
[…] too. The DH community is supportive and experimentally inclined; you’ll be right at home asking how things work, experimenting, and emulating what you like. And more locally, consultants, training, and support […]
[…] a digital scholarly edition […]
[…] a gallery of primary sources […]
[…] Miriam. (2014, February 01). How did they make that? Retrieved September 29, 2020, from https://miriamposner.com/blog/how-did-they-make-that/ […]
[…] Leia o posto original. […]
[…] Miriam Posner, “How did they Make That?” […]
[…] the wiki highlights student projects on its Featured Projects page. Following Miriam Posner’s “How Did They Make That?” template, this page focuses on the tools and platforms used for each project, and offers […]
[…] Digital Scholarship Group is taking inspiration from Miriam Posner’s famous blog post, How Did They Make That?, and offering a learning series on how specific digital scholarship and digital humanities […]